Financials › Fire, Marine And Casualty Insurance

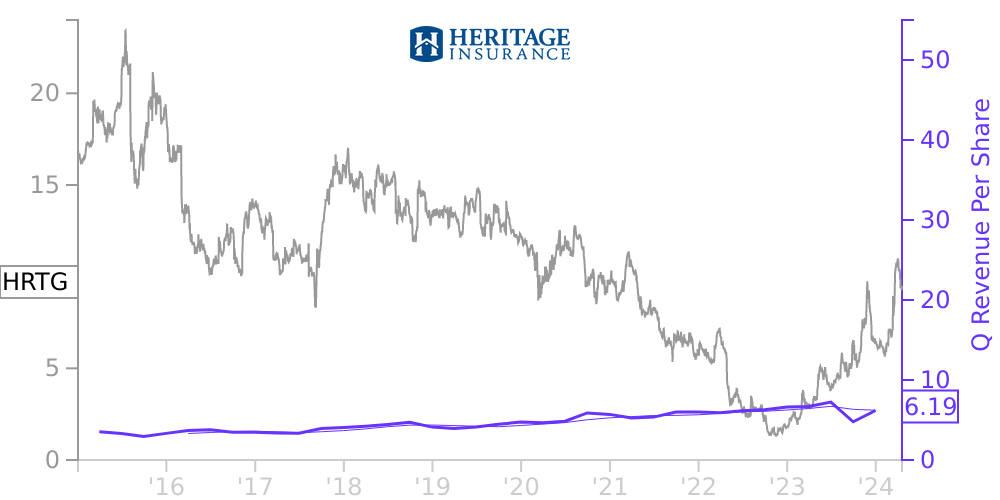
HRTG Stock Price Correlated With Heritage Insurance Holdings Financials
External Links ⌄
Income Statement
Cash Flow
Balance Sheet
HRTG Income Statement
Enable JavaScript and reload
Revenue, Net:
Cost of Goods & Services Sold:
Gross Profit:
Selling, General & Admin Expense:
Research & Development Expense:
Total Operating Expenses:
Operating Income:
Income Taxes:
Net Income:
HRTG Cash Flow
Enable JavaScript and reload
Operating Activities Net Income:
Depreciation, Depletion & Amortization:
Change in Accounts Receiveable:
Net Cash from Operations:
Repurchases/Buybacks Common Stock:
Issuance of Long-term Debt:
Cash Dividends Paid:
Net Cash from Financing Activities:
Property, Plant & Equipment Purchases:
Purchases of Businesses, Net of Cash:
Net Cash from Investing Activities:
Net Change in Cash & Equivalents:
HRTG Balance Sheet
Enable JavaScript and reload
Cash and Cash Equivalents:
Short-Term Investments:
Accounts Receivable, Net:
Inventories:
Total Current Assets:
Property, Plant & Equipment, Net:
Total Assets:
Accounts Payable:
Current Portion of Long-Term Debt:
Total Short-Term Liabilities:
Long Term Debt, Non-Current Portion:
Total Long-Term Liabilities:
Total Liabilities:
COMPANY PROFILE
Note 1. Basis of Presentation, Nature of Business and Significant Accounting Policies and Practices Business Description Heritage Insurance Holdings, Inc. is an insurance holding company. Our insurance subsidiaries are Heritage Property & Casualty Insurance Company (“Heritage P&C”), Zephyr Insurance Company (“Zephyr”), Narragansett Bay Insurance Company (“NBIC”) and Pawtucket Insurance Company (“PIC”). PIC is currently inactive and has no policies in force or outstanding claims. Our other subsidiaries include: Heritage MGA, LLC (“MGA”), the managing general agent that manages substantially all aspects of our insurance subsidiaries’ business; Contractors’ Alliance Network, LLC, our vendor network manager; Skye Lane Properties, LLC, our property management subsidiary; Osprey Re Ltd., our reinsurance subsidiary that may provide a portion of the reinsurance protection purchased by our insurance subsidiaries; Heritage Insurance Claims, LLC, an inactive subsidiary reserved for future development; Zephyr Acquisition Company (“ZAC”); NBIC Holdings, Inc., NBIC Service Company which provides services to NBIC and Westwind Underwriters, Inc., an inactive subsidiary of NBIC Holdings, Inc. Our primary products are personal and commercial residential insurance, which we currently offer in Alabama, California, Connecticut, Delaware, Florida, Georgia, Hawaii, Maryland, Massachusetts, Mississippi, New Jersey, New York, North Carolina, Rhode Island, South Carolina, and Virginia. We conduct our operations under a single reporting segment. Basis of Presentation The consolidated financial statements include the accounts of Heritage Insurance Holdings, Inc. and its wholly-owned subsidiaries. The accompanying consolidated financial statements include the accounts of the Company and all other entities in which the Company has a controlling financial interest (none of which are variable interest entities). All intercompany accounts and transactions have been eliminated in consolidation.
Use of Estimates The preparation of consolidated financial statements in conformity with United States Generally Accepted Accounting Principles (“U.S. GAAP”) requires us to make estimates and assumptions about future events that affect the amounts reported in our consolidated financial statements and accompanying notes. We evaluate our estimates on an ongoing basis when updated information related to such estimates becomes available. We base our estimates on historical experience and information available to us at the time these estimates are made. Actual results could differ materially from these estimates.
Cash and Cash Equivalents The Company’s cash and cash equivalents include demand deposits with financial institutions and short-term, highly-liquid financial instruments with original maturities of three months or less when purchased. The carrying amounts reported in the consolidated balance sheets for interest bearing deposits approximate their fair value because of the short maturity of these financial instruments. To the extent there are negative cash balances with any individual financial institution, the Company excludes the negative amount from cash and cash equivalents neg ative cash balances and reports as accounts payable and other liabilities
Restricted Cash Restricted cash related to individual state regulatory deposits, was $ 5.4 million for each of the respective years ended December 31, 2021 and 2020. The Company earned interest income of $ 11,918 and $ 33,400 on its restricted cash deposits.
Investments Fixed-Maturity Securities The Company classifies all of its investments in debt securities as available-for-sale and reports them at fair value. Subsequent to its acquisition of debt securities available-for-sale, the Company records changes in value through the date of disposition as unrealized holding gains and losses, net of tax effects, and includes them as a component of other comprehensive income. Refer to Note 2 “Investments” to our consolid
Free historical financial statements for Heritage Insurance Holdings Inc. See how revenue, income, cash flow, and balance sheet financials have changed over 45 quarters since 2015. Compare with HRTG stock chart to see long term trends.
Data imported from Heritage Insurance Holdings Inc SEC filings. Check original filings before making any investment decision.