Consumer Staples › Sugar And Confectionery Products

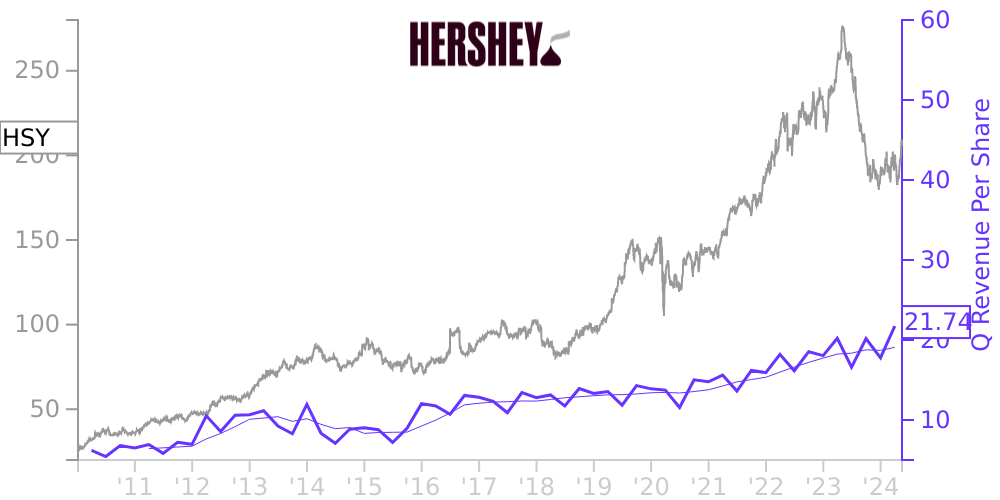
HSY Stock Price Correlated With Hershey Co Financials
External Links ⌄
Income Statement
Cash Flow
Balance Sheet
HSY Income Statement
Enable JavaScript and reload
Revenue, Net:
Cost of Goods & Services Sold:
Gross Profit:
Selling, General & Admin Expense:
Research & Development Expense:
Total Operating Expenses:
Operating Income:
Income Taxes:
Net Income:
HSY Cash Flow
Enable JavaScript and reload
Operating Activities Net Income:
Depreciation, Depletion & Amortization:
Change in Accounts Receiveable:
Net Cash from Operations:
Repurchases/Buybacks Common Stock:
Issuance of Long-term Debt:
Cash Dividends Paid:
Net Cash from Financing Activities:
Property, Plant & Equipment Purchases:
Purchases of Businesses, Net of Cash:
Net Cash from Investing Activities:
Net Change in Cash & Equivalents:
HSY Balance Sheet
Enable JavaScript and reload
Cash and Cash Equivalents:
Short-Term Investments:
Accounts Receivable, Net:
Inventories:
Total Current Assets:
Property, Plant & Equipment, Net:
Total Assets:
Accounts Payable:
Current Portion of Long-Term Debt:
Total Short-Term Liabilities:
Long Term Debt, Non-Current Portion:
Total Long-Term Liabilities:
Total Liabilities:
COMPANY PROFILE
1. BASIS OF PRESENTATION
Our unaudited consolidated financial statements provided in this report include the accounts of the Company and our majority-owned subsidiaries and entities in which we have a controlling financial interest after the elimination of intercompany accounts and transactions. We have a controlling financial interest if we own a majority of the outstanding voting common stock and the noncontrolling shareholders do not have substantive participating rights, or we have significant control over an entity through contractual or economic interests in which we are the primary beneficiary. We prepared these statements in accordance with the instructions to Form 10-Q. These statements do not include all of the information and footnotes required by U.S. generally accepted accounting principles (“GAAP”) for complete financial statements.
We included all adjustments (consisting only of normal recurring accruals) which we believe were considered necessary for a fair presentation. We reclassified certain prior year amounts to conform to the 2010 presentation. Operating results for the three months ended April 4, 2010 may not be indicative of the results that may be expected for the year ending December 31, 2010, because of the seasonal effects of our business. For more information, refer to the consolidated financial statements and notes included in our 2009 Annual Report on Form 10-K.
Free historical financial statements for Hershey Co.. See how revenue, income, cash flow, and balance sheet financials have changed over 65 quarters since 2010. Compare with HSY stock chart to see long term trends.
Data imported from Hershey Co. SEC filings. Check original filings before making any investment decision.