Health Care › Pharmaceutical Preparations

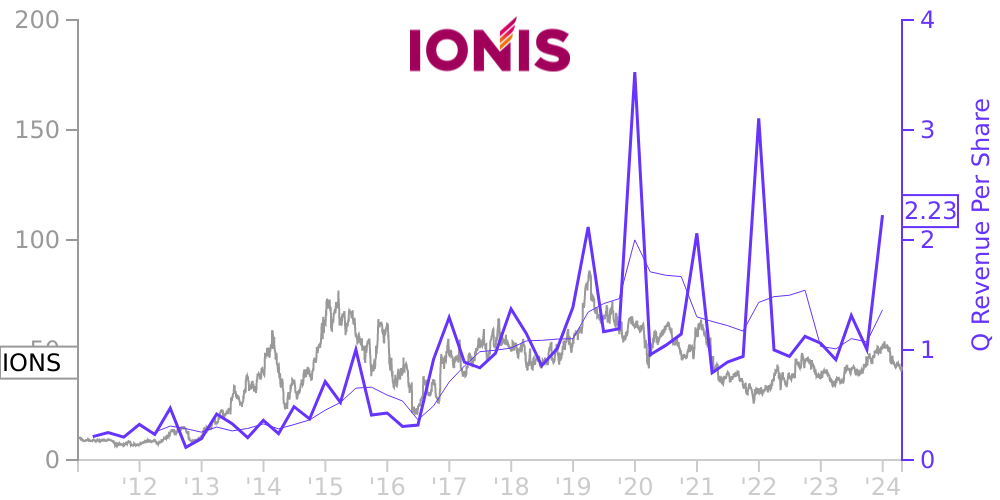
IONS Stock Price Correlated With Ionis Pharmaceuticals Financials
External Links ⌄
Income Statement
Cash Flow
Balance Sheet
IONS Income Statement
Enable JavaScript and reload
Revenue, Net:
Cost of Goods & Services Sold:
Gross Profit:
Selling, General & Admin Expense:
Research & Development Expense:
Total Operating Expenses:
Operating Income:
Income Taxes:
Net Income:
IONS Cash Flow
Enable JavaScript and reload
Operating Activities Net Income:
Depreciation, Depletion & Amortization:
Change in Accounts Receiveable:
Net Cash from Operations:
Repurchases/Buybacks Common Stock:
Issuance of Long-term Debt:
Cash Dividends Paid:
Net Cash from Financing Activities:
Property, Plant & Equipment Purchases:
Purchases of Businesses, Net of Cash:
Net Cash from Investing Activities:
Net Change in Cash & Equivalents:
IONS Balance Sheet
Enable JavaScript and reload
Cash and Cash Equivalents:
Short-Term Investments:
Accounts Receivable, Net:
Inventories:
Total Current Assets:
Property, Plant & Equipment, Net:
Total Assets:
Accounts Payable:
Current Portion of Long-Term Debt:
Total Short-Term Liabilities:
Long Term Debt, Non-Current Portion:
Total Long-Term Liabilities:
Total Liabilities:
COMPANY PROFILE
1. Organization and Significant Accounting Policies
Basis of Presentation
In our consolidated financial statements we included the accounts of Ionis Pharmaceuticals, Inc. and the consolidated
results of our subsidiary, Akcea Therapeutics, Inc. and its wholly owned subsidiaries (“we”, “us” or “our”). We formed Akcea in December 2014. In July 2017, Akcea completed an initial public offering, or IPO, which reduced our ownership of Akcea’s
common stock below 100 percent. In October 2020, we completed a merger transaction with Akcea such that following the completion of the merger,
Akcea became our wholly owned subsidiary. We will refer to this transaction as the Akcea Merger throughout the remainder of this document. We reflected changes in our ownership percentage in our financial statements as an adjustment to noncontrolling
interest in the period the changes occurred.
Organization and Business Activity
We incorporated in California on January 10, 1989. In conjunction with our IPO, we reorganized as a Delaware corporation
in April 1991. We were organized principally to develop human therapeutic medicines using antisense technology. In December 2015, we changed our name from Isis Pharmaceuticals, Inc. to Ionis Pharmaceuticals, Inc.
Basic and Diluted Net Income (Loss) per Share
Basic net income (loss) per share
We compute basic net income (loss) per share by dividing the total net income (loss) attributable to our common
stockholders by our weighted-average number of common shares outstanding during the period. For the year ended December 31, 2021, we did not have to consider Akcea results separately in our calculation because we owned 100 percent of Akcea for the entire period. Our basic net loss per share for the year ended December 31, 2021 was $0.20.
For the years ended December 31, 2020 and 2019, we calculated total net income (loss) attributable to our common
stockholders for each year using our net income (loss) for Ionis on a stand-alone basis plus our share of Akcea’s net income (loss) for the period. To calculate the portion of Akcea’s net income (loss) attributable to our ownership for each year, we
multiplied Akcea’s income (loss) per share by the weighted average shares we owned in Akcea during the period. As a result of this calculation, our total net income (loss) available to Ionis common stockholders for the calculation of net income (loss)
per share is different than net income (loss) attributable to Ionis Pharmaceuticals, Inc. common stockholders in our consolidated statements of operations for each year.
We calculated our basic net loss per share for the year ended December 31, 2020 as follows (in thousands, except
per share amounts):
Year Ended December 31, 2020
Weighted
Average Shares
Owned in Akcea
Akcea ’ s
Net Loss
Per Share
Basic Net Loss
Per Share
Calculation
Akcea’s net loss in the pre-merger period attributable to our ownership
77,095
$
(1.45
)
$
(111,775
)
Akcea’s net loss in the post-merger period attributable to our ownership
(85,987
)
Akcea’s total net loss attributable to our ownership
$
(197,762
)
Ionis’ stand-alone net loss
(246,702
)
Net loss available to Ionis common stockholders
$
(444,464
)
Weighted average shares outstanding
139,612
Basic net loss per share
$
(3.18
)
We calculated our basic net income per share for the year ended December 31, 2019 as follows (in thousands, except per share amounts):
Year Ended December 31, 2019
Weighted
Average Shares
Owned in Akcea
Akcea ’ s
Net Income
Per Share
Basic Net Income
Per Share
Calculation
Common shares
70,100
$
0.49
$
34,073
Akcea’s net income attributable to our ownership
$
34,073
Ionis’ stand-alone net income
246,487
Net income available to Ionis common stockholders
$
280,560
Weighted average shares outstanding
139,998
Basic net income per share
$
2.00
Diluted net income (loss) per share
For the years ended December 31, 2021
Free historical financial statements for Ionis Pharmaceuticals Inc. See how revenue, income, cash flow, and balance sheet financials have changed over 61 quarters since 2011. Compare with IONS stock chart to see long term trends.
Data imported from Ionis Pharmaceuticals Inc SEC filings. Check original filings before making any investment decision.