Consumer Staples › Sugar And Confectionery Products

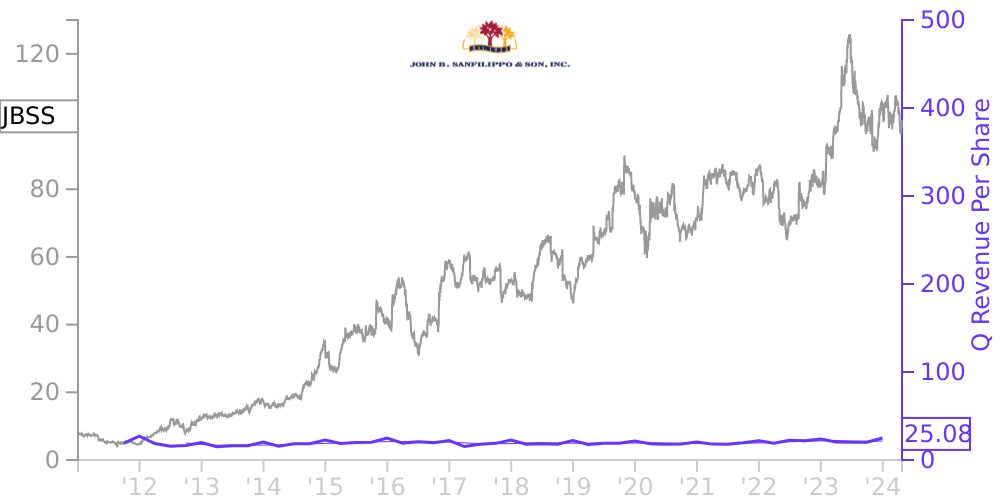
JBSS Stock Price Correlated With John B Sanfilippo and Son Financials
External Links ⌄
Income Statement
Cash Flow
Balance Sheet
JBSS Income Statement
Enable JavaScript and reload
Revenue, Net:
Cost of Goods & Services Sold:
Gross Profit:
Selling, General & Admin Expense:
Research & Development Expense:
Total Operating Expenses:
Operating Income:
Income Taxes:
Net Income:
JBSS Cash Flow
Enable JavaScript and reload
Operating Activities Net Income:
Depreciation, Depletion & Amortization:
Change in Accounts Receiveable:
Net Cash from Operations:
Repurchases/Buybacks Common Stock:
Issuance of Long-term Debt:
Cash Dividends Paid:
Net Cash from Financing Activities:
Property, Plant & Equipment Purchases:
Purchases of Businesses, Net of Cash:
Net Cash from Investing Activities:
Net Change in Cash & Equivalents:
JBSS Balance Sheet
Enable JavaScript and reload
Cash and Cash Equivalents:
Short-Term Investments:
Accounts Receivable, Net:
Inventories:
Total Current Assets:
Property, Plant & Equipment, Net:
Total Assets:
Accounts Payable:
Current Portion of Long-Term Debt:
Total Short-Term Liabilities:
Long Term Debt, Non-Current Portion:
Total Long-Term Liabilities:
Total Liabilities:
COMPANY PROFILE
Basis of Presentation and Consolidation and Description of Business
Our consolidated financial statements include the accounts of John B. Sanfilippo & Son, Inc., and our wholly-owned subsidiary, JBSS Ventures, LLC. Our fiscal year ends on the last Thursday of June each year, and typically consists of fifty-two
weeks (four thirteen-week quarters). The accompanying consolidated financial statements and related footnotes are presented in accordance with accounting principles generally accepted in the United States of America (“GAAP”).
We are one of the leading processors and distributors of peanuts, pecans, cashews, walnuts, almonds, and other nuts in the United States. These nuts are sold under our Fisher, Orchard Valley Harvest,
Squirrel Brand, Southern Style Nuts
and Sunshine Country
brand names and under a variety of private brands. We also market and distribute, and in most cases, manufacture or process, a diverse product line of food and snack products, including peanut butter, almond butter, cashew butter, candy and confections, snack and trail mixes, snack bites, sunflower kernels, dried fruit, corn snacks, chickpea snacks, sesame sticks and other sesame snack products under our brand names and under private brands. Our products are sold through three primary distribution channels, including food retailers in the consumer channel, commercial ingredient users and contract packaging customers.
Free historical financial statements for John B Sanfilippo and Son Inc. See how revenue, income, cash flow, and balance sheet financials have changed over 59 quarters since 2011. Compare with JBSS stock chart to see long term trends.
Data imported from John B Sanfilippo and Son Inc SEC filings. Check original filings before making any investment decision.