Financials › Security Brokers, Dealers And Flotation Companies

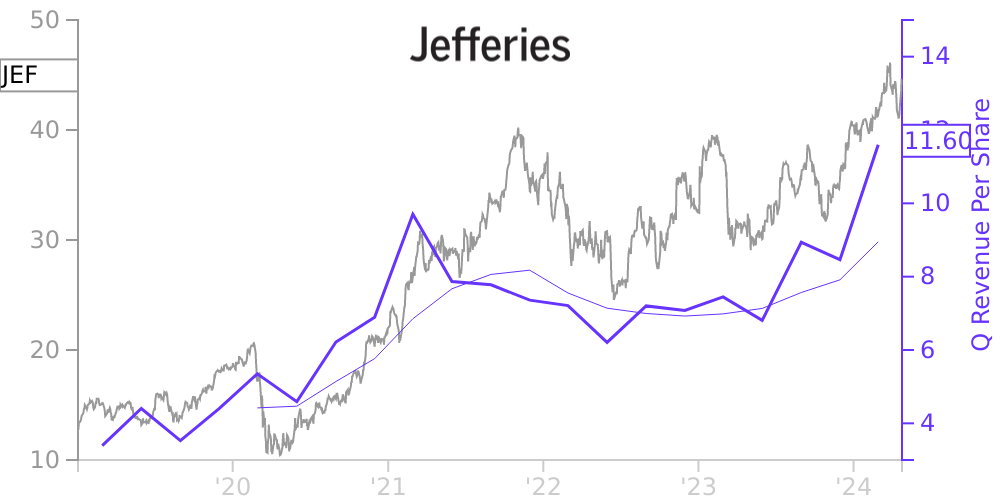
JEF Stock Price Correlated With Jefferies Financial Financials
External Links ⌄
Income Statement
Cash Flow
Balance Sheet
JEF Income Statement
Enable JavaScript and reload
Revenue, Net:
Cost of Goods & Services Sold:
Gross Profit:
Selling, General & Admin Expense:
Research & Development Expense:
Total Operating Expenses:
Operating Income:
Income Taxes:
Net Income:
JEF Cash Flow
Enable JavaScript and reload
Operating Activities Net Income:
Depreciation, Depletion & Amortization:
Change in Accounts Receiveable:
Net Cash from Operations:
Repurchases/Buybacks Common Stock:
Issuance of Long-term Debt:
Cash Dividends Paid:
Net Cash from Financing Activities:
Property, Plant & Equipment Purchases:
Purchases of Businesses, Net of Cash:
Net Cash from Investing Activities:
Net Change in Cash & Equivalents:
JEF Balance Sheet
Enable JavaScript and reload
Cash and Cash Equivalents:
Short-Term Investments:
Accounts Receivable, Net:
Inventories:
Total Current Assets:
Property, Plant & Equipment, Net:
Total Assets:
Accounts Payable:
Current Portion of Long-Term Debt:
Total Short-Term Liabilities:
Long Term Debt, Non-Current Portion:
Total Long-Term Liabilities:
Total Liabilities:
COMPANY PROFILE
Change in Year End
On October 2, 2018, our Board of Directors approved a change to our fiscal year end from a calendar year basis to a fiscal year ending on November 30. Our 2018 fiscal year consists of the eleven month transition period beginning January 1, 2018 through November 30, 2018. Financial statements for 2017 continue to be presented on the basis of our previous calendar year end.
The following is selected financial data for the eleven month transition period ending November 30, 2018, and the comparable prior year period. Jefferies Group financial data is presented in each year based on the twelve months ended November 30. All other results are based on the eleven months ended November 30 for both years (in thousands, except per share amounts).
Eleven Months Ended November 30,
2018
2017 (Unaudited)
Net revenues
$
3,764,034
$
4,031,333
Total expenses
3,524,957
3,336,359
Income (loss) related to associated companies
57,023
(76,864
)
Income from continuing operations before income taxes
296,100
618,110
Income tax provision
19,008
195,550
Income from continuing operations
277,092
422,560
Income from discontinued operations, including gain on disposal, net of taxes
773,984
267,321
Net income attributable to the redeemable noncontrolling interests
(37,263
)
(78,506
)
Net income attributable to Jefferies Financial Group Inc. common shareholders
1,022,318
610,277
Basic earnings per common share attributable to Jefferies Financial Group Inc. common shareholders:
Income from continuing operations
$
0.82
$
1.14
Income from discontinued operations, including gain on disposal
2.11
0.51
Net income
$
2.93
$
1.65
Diluted earnings per common share attributable to Jefferies Financial Group Inc. common shareholders:
Income from continuing operations
$
0.81
$
1.13
Income from discontinued operations, including gain on disposal
2.09
0.50
Net income
$
2.90
$
1.63
Free historical financial statements for Jefferies Financial Group Inc.. See how revenue, income, cash flow, and balance sheet financials have changed over 30 quarters since 2019. Compare with JEF stock chart to see long term trends.
Data imported from Jefferies Financial Group Inc. SEC filings. Check original filings before making any investment decision.