Consumer Staples › Retail-Grocery Stores
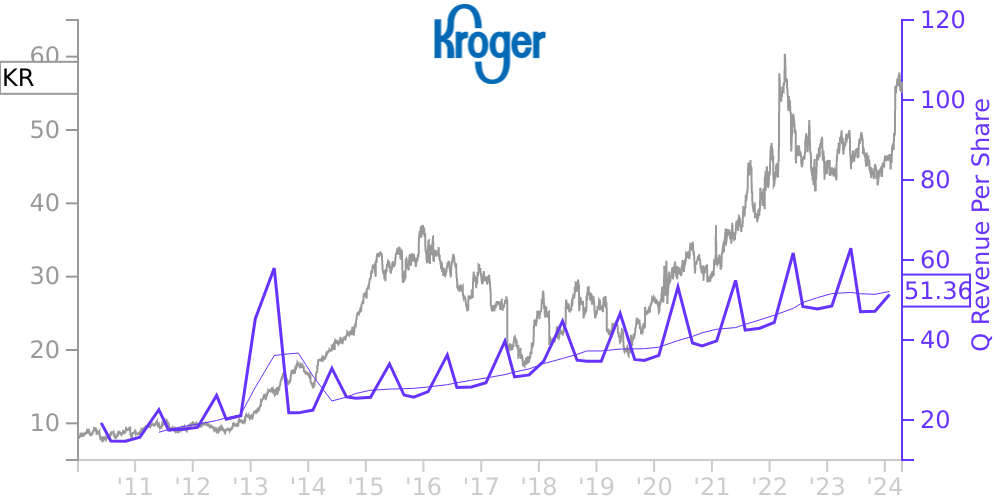
KR Stock Price Correlated With Kroger Co Financials
External Links ⌄
Income Statement
Cash Flow
Balance Sheet
KR Income Statement
Enable JavaScript and reload
Revenue, Net:
Cost of Goods & Services Sold:
Gross Profit:
Selling, General & Admin Expense:
Research & Development Expense:
Total Operating Expenses:
Operating Income:
Income Taxes:
Net Income:
KR Cash Flow
Enable JavaScript and reload
Operating Activities Net Income:
Depreciation, Depletion & Amortization:
Change in Accounts Receiveable:
Net Cash from Operations:
Repurchases/Buybacks Common Stock:
Issuance of Long-term Debt:
Cash Dividends Paid:
Net Cash from Financing Activities:
Property, Plant & Equipment Purchases:
Purchases of Businesses, Net of Cash:
Net Cash from Investing Activities:
Net Change in Cash & Equivalents:
KR Balance Sheet
Enable JavaScript and reload
Cash and Cash Equivalents:
Short-Term Investments:
Accounts Receivable, Net:
Inventories:
Total Current Assets:
Property, Plant & Equipment, Net:
Total Assets:
Accounts Payable:
Current Portion of Long-Term Debt:
Total Short-Term Liabilities:
Long Term Debt, Non-Current Portion:
Total Long-Term Liabilities:
Total Liabilities:
COMPANY PROFILE
The Kroger Co. is one of the largest retailers in the world based on annual sales. The Company also manufactures and processes food for sale by its supermarkets and online. The accompanying financial statements include the consolidated accounts of the Company, its wholly-owned subsidiaries and other consolidated entities.
Free historical financial statements for Kroger Co.. See how revenue, income, cash flow, and balance sheet financials have changed over 65 quarters since 2010. Compare with KR stock chart to see long term trends.
Data imported from Kroger Co. SEC filings. Check original filings before making any investment decision.