Communication › Cable And Other Pay Television Services

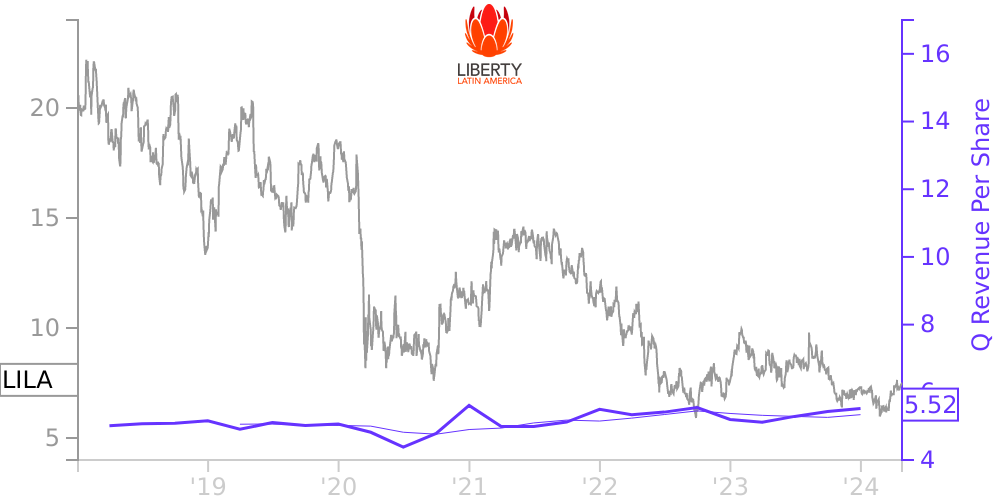
LILA Stock Price Correlated With Liberty Latin America Financials
External Links ⌄
Income Statement
Cash Flow
Balance Sheet
LILA Income Statement
Enable JavaScript and reload
Revenue, Net:
Cost of Goods & Services Sold:
Gross Profit:
Selling, General & Admin Expense:
Research & Development Expense:
Total Operating Expenses:
Operating Income:
Income Taxes:
Net Income:
LILA Cash Flow
Enable JavaScript and reload
Operating Activities Net Income:
Depreciation, Depletion & Amortization:
Change in Accounts Receiveable:
Net Cash from Operations:
Repurchases/Buybacks Common Stock:
Issuance of Long-term Debt:
Cash Dividends Paid:
Net Cash from Financing Activities:
Property, Plant & Equipment Purchases:
Purchases of Businesses, Net of Cash:
Net Cash from Investing Activities:
Net Change in Cash & Equivalents:
LILA Balance Sheet
Enable JavaScript and reload
Cash and Cash Equivalents:
Short-Term Investments:
Accounts Receivable, Net:
Inventories:
Total Current Assets:
Property, Plant & Equipment, Net:
Total Assets:
Accounts Payable:
Current Portion of Long-Term Debt:
Total Short-Term Liabilities:
Long Term Debt, Non-Current Portion:
Total Long-Term Liabilities:
Total Liabilities:
COMPANY PROFILE
Basis of Presentation See the Glossary of defined terms at the beginning of this Annual Report on Form 10-K for terms used throughout the consolidated financial statements.
General
Liberty Latin America Ltd. is a registered company in Bermuda that primarily includes: (i) C&W; (ii) Liberty Communications PR; (iii) VTR; and (iv) LBT CT Communications, S.A. (a less than wholly-owned entity) and its subsidiaries, which include Cabletica and, as of August 9, 2021 and as further described in note 4, Telefónica Costa Rica. C&W owns less than 100% of certain of its consolidated subsidiaries, including C&W Bahamas, C&W Jamaica and CWP.
We are an international provider of fixed, mobile and subsea telecommunications services. We provide:
A. residential and B2B services in:
i. over 20 countries across Latin America and the Caribbean through two of our reportable segments, C&W Caribbean and Networks, and C&W Panama;
ii. Puerto Rico, through our reportable segment Liberty Puerto Rico;
iii. Chile, through our reportable segment VTR;
iv. Costa Rica, through Cabletica and its subsidiary, Telefónica Costa Rica; and
B. through the Networks & LatAm business of our C&W Caribbean and Networks segment, (i) B2B services in certain other countries in Latin America and the Caribbean and (ii) wholesale communication services over its subsea and terrestrial fiber optic cable networks that connect approximately 40 markets in that region.
The accompanying consolidated financial statements have been prepared in accordance with U.S. GAAP.
Prior to the first quarter of 2021, VTR and Cabletica were collectively one operating segment. As a result of organizational changes during 2021, these operations became separate operating segments. Following the Telefónica Costa Rica Acquisition on August 9, 2021, as further described in note 4, Cabletica and Telefónica Costa Rica now comprise our Costa Rica operating and reportable segment. For additional information regarding our segments, see note 21.
Effective September 29, 2021, in connection with the pending formation of the Chile JV, as further described in note 9, we began accounting for the Chile JV Entities as “held for sale.” Accordingly, the assets and liabilities of the Chile JV Entities, excluding certain cash balances, are included in assets held for sale and liabilities associated with assets held for sale, respectively, on our December 31, 2021 consolidated balance sheet. Consistent with the applicable guidance, we have not reflected similar reclassifications to exclude the Chile JV Entities from continuing operations in our consolidated statements of operations or cash flows and related footnote disclosures. For additional information, see note 9.
Correction of Immaterial Errors
During 2021, we identified certain errors in our previously reported consolidated financial statements, primarily related to the understatement of depreciation and amortization of long-lived assets, and to a lesser extent, asset impairments. The errors are predominantly related to the understatement of depreciation expense associated with property and equipment that was acquired in connection with business combination transactions at Liberty Puerto Rico that closed during 2012 and 2015. The errors did not have an impact on our revenue, key segment performance measure (Adjusted OIBDA), cash flow from operations or property and equipment additions. We have completed a quantitative and qualitative evaluation of the errors and concluded that they are immaterial to the previously issued consolidated financial statements. Notwithstanding this evaluation, we have revised our December 31, 2020 consolidated balance sheet and our consolidated statements of operations, comprehensive loss, equity and cash flows for the years ended December 31, 2020 and 2019 for these errors. The tables below set forth the adjustments to the primary consolidated financial statement line items resulting from these adjustments. In addition, we reco
Free historical financial statements for Liberty Latin America Ltd.. See how revenue, income, cash flow, and balance sheet financials have changed over 33 quarters since 2018. Compare with LILA stock chart to see long term trends.
Data imported from Liberty Latin America Ltd. SEC filings. Check original filings before making any investment decision.