Financials › Real Estate Investment Trusts

LOAN Stock Price Correlated With Manhattan Bridge Capital Financials
External Links ⌄
Income Statement
Cash Flow
Balance Sheet
LOAN Income Statement
Enable JavaScript and reload
Revenue, Net:
Cost of Goods & Services Sold:
Gross Profit:
Selling, General & Admin Expense:
Research & Development Expense:
Total Operating Expenses:
Operating Income:
Income Taxes:
Net Income:
LOAN Cash Flow
Enable JavaScript and reload
Operating Activities Net Income:
Depreciation, Depletion & Amortization:
Change in Accounts Receiveable:
Net Cash from Operations:
Repurchases/Buybacks Common Stock:
Issuance of Long-term Debt:
Cash Dividends Paid:
Net Cash from Financing Activities:
Property, Plant & Equipment Purchases:
Purchases of Businesses, Net of Cash:
Net Cash from Investing Activities:
Net Change in Cash & Equivalents:
LOAN Balance Sheet
Enable JavaScript and reload
Cash and Cash Equivalents:
Short-Term Investments:
Accounts Receivable, Net:
Inventories:
Total Current Assets:
Property, Plant & Equipment, Net:
Total Assets:
Accounts Payable:
Current Portion of Long-Term Debt:
Total Short-Term Liabilities:
Long Term Debt, Non-Current Portion:
Total Long-Term Liabilities:
Total Liabilities:
COMPANY PROFILE
1.
The Company
Manhattan
Bridge Capital, Inc. (“MBC”) and its wholly-owned subsidiary, MBC Funding II Corp. (“MBC Funding”) (collectively
the “Company”), offer short-term, secured, non–banking loans (sometimes referred to as “hard money” loans)
to real estate investors to fund their acquisition, renovation, rehabilitation or development of residential or commercial properties
located in the New York metropolitan area, including New Jersey and Connecticut, and in Florida.
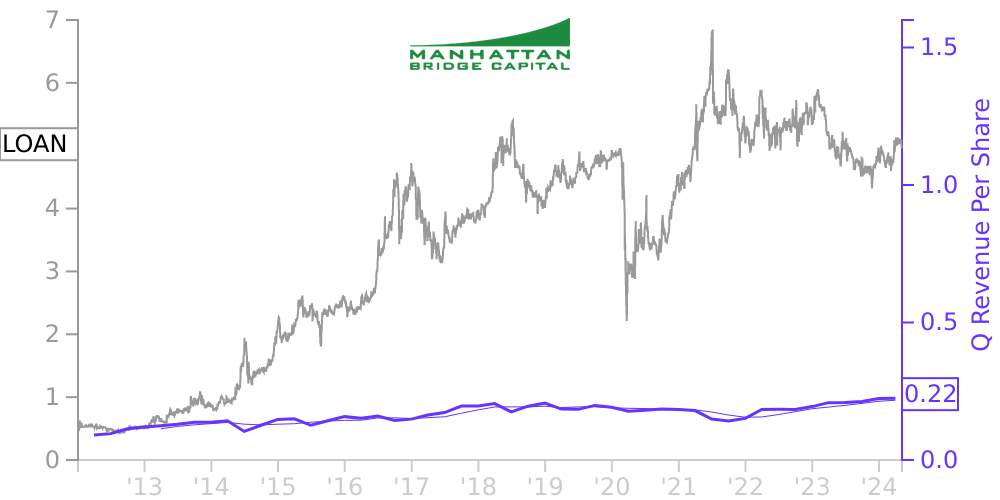
Free historical financial statements for Manhattan Bridge Capital Inc. See how revenue, income, cash flow, and balance sheet financials have changed over 57 quarters since 2012. Compare with LOAN stock chart to see long term trends.
Data imported from Manhattan Bridge Capital Inc SEC filings. Check original filings before making any investment decision.