Communication › Services-Amusement And Recreation Services

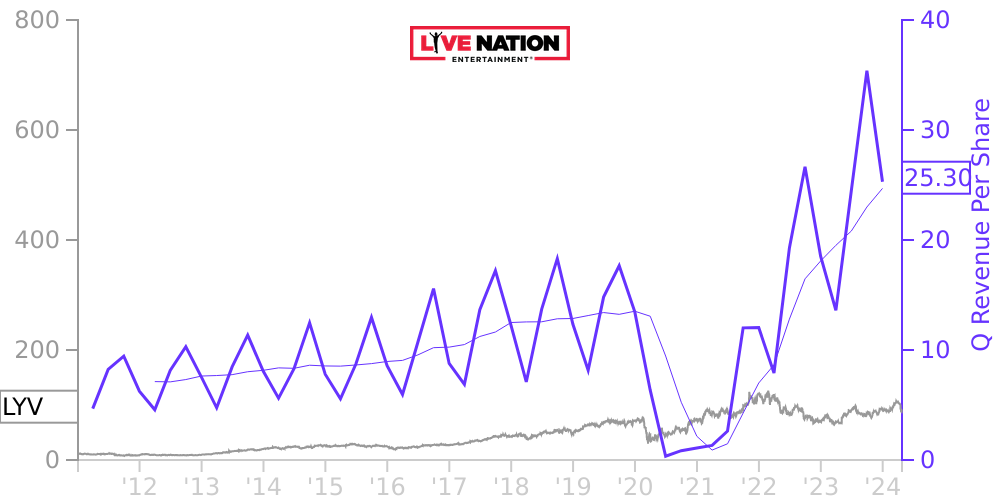
LYV Stock Price Correlated With Live Nation Entertainment Financials
External Links ⌄
Income Statement
Cash Flow
Balance Sheet
LYV Income Statement
Enable JavaScript and reload
Revenue, Net:
Cost of Goods & Services Sold:
Gross Profit:
Selling, General & Admin Expense:
Research & Development Expense:
Total Operating Expenses:
Operating Income:
Income Taxes:
Net Income:
LYV Cash Flow
Enable JavaScript and reload
Operating Activities Net Income:
Depreciation, Depletion & Amortization:
Change in Accounts Receiveable:
Net Cash from Operations:
Repurchases/Buybacks Common Stock:
Issuance of Long-term Debt:
Cash Dividends Paid:
Net Cash from Financing Activities:
Property, Plant & Equipment Purchases:
Purchases of Businesses, Net of Cash:
Net Cash from Investing Activities:
Net Change in Cash & Equivalents:
LYV Balance Sheet
Enable JavaScript and reload
Cash and Cash Equivalents:
Short-Term Investments:
Accounts Receivable, Net:
Inventories:
Total Current Assets:
Property, Plant & Equipment, Net:
Total Assets:
Accounts Payable:
Current Portion of Long-Term Debt:
Total Short-Term Liabilities:
Long Term Debt, Non-Current Portion:
Total Long-Term Liabilities:
Total Liabilities:
COMPANY PROFILE
THE COMPANY AND SUMMARY OF SIGNIFICANT ACCOUNTING POLICIES History
Live Nation was incorporated in Delaware on August 2, 2005 in preparation for the contribution and transfer by Clear Channel Communications, Inc. of substantially all of its entertainment assets and liabilities to us. We completed this separation on December 21, 2005 and became a publicly traded company on the New York Stock Exchange trading under the symbol “LYV.”
On January 25, 2010, we merged with Ticketmaster Entertainment LLC and it became a wholly-owned subsidiary of Live Nation. Effective with the merger, Live Nation, Inc. changed its name to Live Nation Entertainment, Inc.
Seasonality
Our Concerts and Sponsorship & Advertising segments typically experience higher revenue and operating income in the second and third quarters as our outdoor venues and festivals are primarily used in or occur from May through October. In addition, the timing of when tickets are sold and the tours of top-grossing acts can impact comparability of quarterly results year over year, although annual results may not be impacted. Our Ticketing segment revenue is impacted by fluctuations in the availability of events for sale to the public, which vary depending upon scheduling by our clients.
Cash flows from our Concerts segment typically have a slightly different seasonality as payments are often made for artist performance fees and production costs for tours in advance of the date the related event tickets go on sale. These artist fees and production costs are expensed when the event occurs. Once tickets for an event go on sale, we generally begin to receive payments from ticket sales at our owned or operated venues and festivals in advance of when the event occurs. We record these ticket sales as revenue when the event occurs. Our seasonality also results in higher balances in cash and cash equivalents, accounts receivable, prepaid expenses, accrued expenses and deferred revenue at different times in the year.
Due to the unprecedented stoppage of our concert and other events globally beginning in mid-March resulting from the global COVID-19 pandemic, we did not experience our typical seasonality trends in 2020 and 2021 even with the resumption of events late in the second quarter of 2021.
Basis of Presentation and Principles of Consolidation
Our consolidated financial statements include all of our accounts, including our majority owned and controlled subsidiaries and VIEs for which we are the primary beneficiary. Intercompany accounts among the consolidated businesses have been eliminated in consolidation. Net income (loss) attributable to noncontrolling interests is reflected in the statements of operations.
Typically, we consolidate entities in which we own more than 50% of the voting common stock and control operations and also VIEs for which we are the primary beneficiary. Investments in nonconsolidated affiliates in which we own more than 20% of the voting common stock or otherwise exercise significant influence over operating and financial policies but not control of the nonconsolidated affiliate are accounted for using the equity method of accounting. Investments in nonconsolidated affiliates in which we own less than 20% of the voting common stock and do not exercise significant influence over operating and financial policies are accounted for at fair value unless the investment does not have a readily determinable fair value in which case the investment is accounted for at cost less any impairment.
All of our cash flow activity reflected on the consolidated statements of cash flows is presented net of any non-cash transactions so the amounts reflected may be different than amounts shown in other places in our consolidated financial statements that are based on accrual accounting and therefore include non-cash amounts. For example, purchases of property, plant and equipment reflected on the consolidated statements of cash flows reflect the amount of cash paid d
Free historical financial statements for Live Nation Entertainment Inc. See how revenue, income, cash flow, and balance sheet financials have changed over 61 quarters since 2011. Compare with LYV stock chart to see long term trends.
Data imported from Live Nation Entertainment Inc SEC filings. Check original filings before making any investment decision.