Communication › Services-Motion Picture Theaters

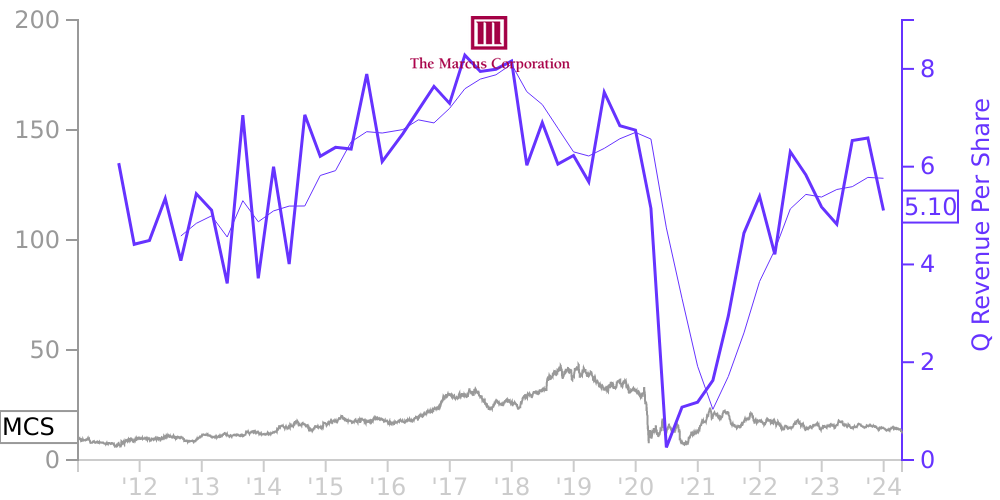
MCS Stock Price Correlated With Marcus Financials
External Links ⌄
Income Statement
Cash Flow
Balance Sheet
MCS Income Statement
Enable JavaScript and reload
Revenue, Net:
Cost of Goods & Services Sold:
Gross Profit:
Selling, General & Admin Expense:
Research & Development Expense:
Total Operating Expenses:
Operating Income:
Income Taxes:
Net Income:
MCS Cash Flow
Enable JavaScript and reload
Operating Activities Net Income:
Depreciation, Depletion & Amortization:
Change in Accounts Receiveable:
Net Cash from Operations:
Repurchases/Buybacks Common Stock:
Issuance of Long-term Debt:
Cash Dividends Paid:
Net Cash from Financing Activities:
Property, Plant & Equipment Purchases:
Purchases of Businesses, Net of Cash:
Net Cash from Investing Activities:
Net Change in Cash & Equivalents:
MCS Balance Sheet
Enable JavaScript and reload
Cash and Cash Equivalents:
Short-Term Investments:
Accounts Receivable, Net:
Inventories:
Total Current Assets:
Property, Plant & Equipment, Net:
Total Assets:
Accounts Payable:
Current Portion of Long-Term Debt:
Total Short-Term Liabilities:
Long Term Debt, Non-Current Portion:
Total Long-Term Liabilities:
Total Liabilities:
COMPANY PROFILE
1. General
Accounting Policies – Refer to the Company’s
audited financial statements (including footnotes) for the fiscal
year ended May 26, 2011, contained in the Company’s Form 10-K
Annual Report for such year, for a description of the
Company’s accounting policies.
Basis of Presentation – The consolidated financial
statements for the 13 weeks ended August 25, 2011 and August 26,
2010 have been prepared by the Company without audit. In
the opinion of management, all adjustments, consisting only of
normal recurring adjustments necessary to present fairly the
unaudited interim financial information at August 25, 2011, and for
all periods presented, have been made. The results of
operations during the interim periods are not necessarily
indicative of the results of operations for the entire year or
other interim periods.
Restricted Cash – Included in cash and cash
equivalents as of August 25, 2011 and May 26, 2011 is restricted
cash of $5,492,000 and $5,310,000, respectively, related to capital
expenditure reserve funds, sinking funds, operating reserves and
replacement reserves. Restricted cash is not considered a cash and
cash equivalent for purposes of the statement of cash flows. As
such, the change in restricted cash is reported as an investing
activity in the consolidated statement of cash flows for the period
ended August 25, 2011. The change in restricted cash for
the period ended August 26, 2010 was not material.
Depreciation and Amortization – Depreciation and
amortization of property and equipment are provided using the
straight-line method over the shorter of the estimated useful lives
of the assets or any related lease terms. Depreciation
expense totaled $8,750,000 and $8,158,000 for the 13 weeks ended
August 25, 2011 and August 26, 2010, respectively.
Comprehensive Income – Total comprehensive income for
the 13 weeks ended August 25, 2011 and August 26, 2010 was
$12,460,000 and $10,073,000, respectively.
Accumulated
other comprehensive loss consists of the following, all presented
net of tax:
August 25,
2011
May 26,
2011
(in thousands)
Unrealized
gain on available for sale investments
$
67
$
101
Unrecognized
loss on terminated interest rate swap agreement
(109
)
(126
)
Net
unrecognized actuarial loss for pension obligation
(2,540
)
(2,540
)
$
(2,582
)
$
(2,565
)
Earnings Per Share
– Net earnings per share (EPS) of Common Stock and Class B
Common Stock is computed using the two-class method. Basic net
earnings per share is computed by dividing net earnings by the
weighted-average number of common shares outstanding less any
non-vested stock. Diluted net earnings per share is computed by
dividing net earnings by the weighted-average number of common
shares outstanding, adjusted for the effect of dilutive stock
options and non-vested stock using the treasury method. Convertible
Class B Common Stock is reflected on an if-converted basis. The
computation of the diluted net earnings per share of Common Stock
assumes the conversion of Class B Common Stock, while the diluted
net earnings per share of Class B Common Stock does not assume the
conversion of those shares.
Holders
of Common Stock are entitled to cash dividends per share equal to
110% of all dividends declared and paid on each share of Class B
Common Stock. As such, the undistributed earnings for each period
are allocated based on the proportionate share of entitled cash
dividends. The computation of diluted net earnings per share of
Common Stock assumes the conversion of Class B Common Stock and, as
such, the undistributed earnings are equal to net earnings for that
computation.
The
following table illustrates the computation of Common Stock and
Class B Common Stock basic and diluted earnings per share for net
earnings and provides a reconciliation of the number of
weighted-average basic and diluted shares outstanding:
13 Weeks Ended
August 25, 2011
13 Weeks Ended
August 26, 2010
(in thousands, except per share da
Free historical financial statements for Marcus Corp.. See how revenue, income, cash flow, and balance sheet financials have changed over 59 quarters since 2011. Compare with MCS stock chart to see long term trends.
Data imported from Marcus Corp. SEC filings. Check original filings before making any investment decision.