Health Care › Services-Hospitals

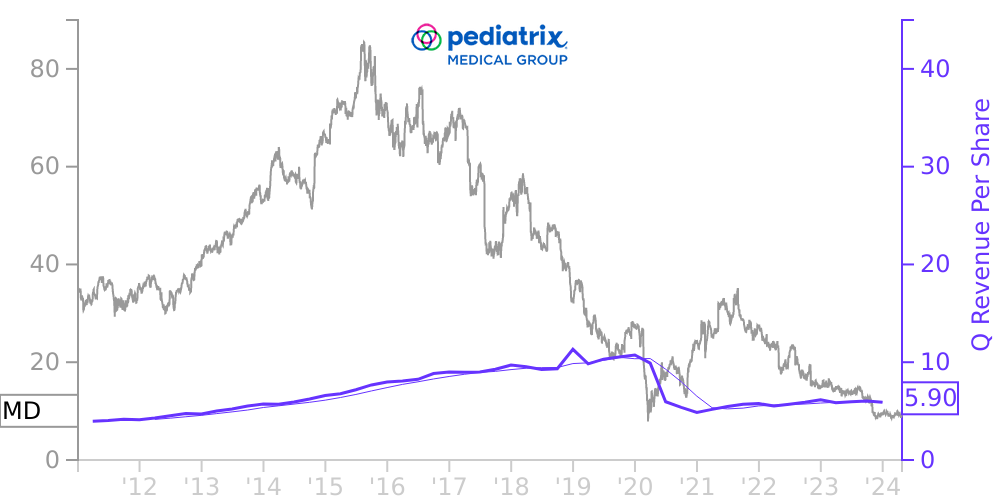
MD Stock Price Correlated With Pediatrix Financials
External Links ⌄
Income Statement
Cash Flow
Balance Sheet
MD Income Statement
Enable JavaScript and reload
Revenue, Net:
Cost of Goods & Services Sold:
Gross Profit:
Selling, General & Admin Expense:
Research & Development Expense:
Total Operating Expenses:
Operating Income:
Income Taxes:
Net Income:
MD Cash Flow
Enable JavaScript and reload
Operating Activities Net Income:
Depreciation, Depletion & Amortization:
Change in Accounts Receiveable:
Net Cash from Operations:
Repurchases/Buybacks Common Stock:
Issuance of Long-term Debt:
Cash Dividends Paid:
Net Cash from Financing Activities:
Property, Plant & Equipment Purchases:
Purchases of Businesses, Net of Cash:
Net Cash from Investing Activities:
Net Change in Cash & Equivalents:
MD Balance Sheet
Enable JavaScript and reload
Cash and Cash Equivalents:
Short-Term Investments:
Accounts Receivable, Net:
Inventories:
Total Current Assets:
Property, Plant & Equipment, Net:
Total Assets:
Accounts Payable:
Current Portion of Long-Term Debt:
Total Short-Term Liabilities:
Long Term Debt, Non-Current Portion:
Total Long-Term Liabilities:
Total Liabilities:
COMPANY PROFILE
1. Basis of Presentation and New Accounting Pronouncements: The accompanying unaudited Consolidated Financial Statements of the Company and the notes thereto presented in this Form 10-Q have been prepared in accordance with the rules and regulations of the Securities and Exchange Commission ("SEC") applicable to interim financial statements, and do not include all disclosures required by accounting principles generally accepted in the United States of America (“GAAP”) for complete financial statements. In the opinion of management, these financial statements include all adjustments, consisting only of normal recurring adjustments, necessary for a fair statement of the results of interim periods. The financial statements include all the accounts of Mednax, Inc. and its consolidated subsidiaries (collectively, “MDX”) together with the accounts of MDX’s affiliated business corporations or professional associations, professional corporations, limited liability companies and partnerships (the “affiliated professional contractors”). Certain subsidiaries of MDX have contractual management arrangements with its affiliated professional contractors, which are separate legal entities that provide physician services in certain states and Puerto Rico. The terms “Mednax” and the “Company” refer collectively to Mednax Inc., its subsidiaries and the affiliated professional contractors. The Compan y is a party to a joint venture in which it owns a 37.5 % economic interest. The Company accounts for this joint venture under the equity method of accounting because the Company exercises significant influence over, but does not control, this entity. The Company was also a party to another joint venture in which it owned a 51 % economic interest and for which it was deemed the primary beneficiary. This joint venture was dissolved in February 2022. The operating results related to this joint venture prior to the dissolution and impacts from such dissolution were not material. The consolidated results of operations for the interim periods presented are not necessarily indicative of the results to be experienced for the entire fiscal year. In addition, the accompanying unaudited Consolidated Financial Statements and the notes thereto should be read in conjunction with the Consolidated Financial Statements and the notes thereto included in the Company’s most recent Annual Report on Form 10-K (the “Form 10-K”).
Free historical financial statements for Pediatrix Medical Group Inc.. See how revenue, income, cash flow, and balance sheet financials have changed over 60 quarters since 2011. Compare with MD stock chart to see long term trends.
Data imported from Pediatrix Medical Group Inc. SEC filings. Check original filings before making any investment decision.