Health Care › Services-Commercial Physical And Biological Research

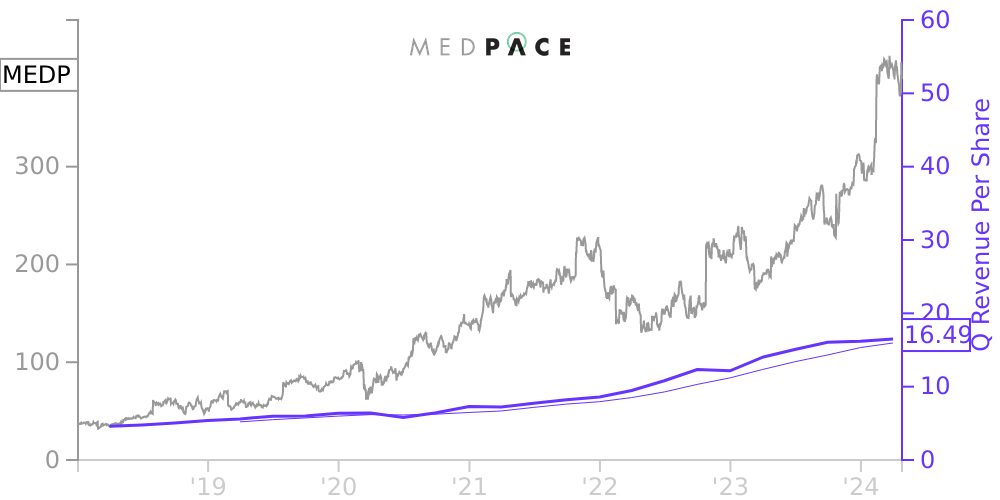
MEDP Stock Price Correlated With Medpace Holdings Financials
External Links ⌄
Income Statement
Cash Flow
Balance Sheet
MEDP Income Statement
Enable JavaScript and reload
Revenue, Net:
Cost of Goods & Services Sold:
Gross Profit:
Selling, General & Admin Expense:
Research & Development Expense:
Total Operating Expenses:
Operating Income:
Income Taxes:
Net Income:
MEDP Cash Flow
Enable JavaScript and reload
Operating Activities Net Income:
Depreciation, Depletion & Amortization:
Change in Accounts Receiveable:
Net Cash from Operations:
Repurchases/Buybacks Common Stock:
Issuance of Long-term Debt:
Cash Dividends Paid:
Net Cash from Financing Activities:
Property, Plant & Equipment Purchases:
Purchases of Businesses, Net of Cash:
Net Cash from Investing Activities:
Net Change in Cash & Equivalents:
MEDP Balance Sheet
Enable JavaScript and reload
Cash and Cash Equivalents:
Short-Term Investments:
Accounts Receivable, Net:
Inventories:
Total Current Assets:
Property, Plant & Equipment, Net:
Total Assets:
Accounts Payable:
Current Portion of Long-Term Debt:
Total Short-Term Liabilities:
Long Term Debt, Non-Current Portion:
Total Long-Term Liabilities:
Total Liabilities:
COMPANY PROFILE
1. BASIS OF PRESENTATION Description of Business Medpace Holdings, Inc. together with its subsidiaries, (“Medpace” or the “Company”), a Delaware corporation, is a global provider of clinical research-based drug and medical device development services. The Company partners with pharmaceutical, biotechnology, and medical device companies in the development and execution of clinical trials. The Company’s drug development services focus on full service Phase I-IV clinical development services and include development plan design, coordinated central laboratory, project management, regulatory affairs, clinical monitoring, data management and analysis, pharmacovigilance new drug application submissions, and post-marketing clinical support. The Company also provides bio-analytical laboratory services, clinical human pharmacology, imaging services, and electrocardiography reading support for clinical trials. The Company’s operations are principally based in North America, Europe, and Asia. Share Repurchases In 2018, the Board of Directors approved a stock repurchase program which has been amended several times to increase the aggregate amount of the stock repurchase authorization. In the first quarter of 2020, the Board of Directors approved an increase in the stock repurchase authorization by $ 50.0 million. In the fourth quarter of 2020, the Board approved the stock repurchase authorization up to $ 150.0 million. In the second quarter of 2021, the Board approved an increase of $ 150.0 million to the stock repurchase program bringing the total repurchase authorization up to $ 300.0 million. For the year ended December 31, 2021, the Company repurchased 377,783 shares for $ 62.1 million. For the year ended December 31, 2020, the Company repurchased 1,183,095 shares for $ 98.3 million. As of December 31, 2021, the Company has remaining authorization of $ 190.5 million remaining under the repurchases program. As of February 10, 2022 the Company's Board of Directors approved an increase of $ 300 million to the Company's stock repurchase program. Repurchases under the share repurchase program are executed in the open market or negotiated transactions under trading plans established pursuant to Rule 10b5-1. The Company constructively retired the repurchased shares associated with these approved share repurchase programs, with all amounts paid in excess of par value reflected within Retained earnings in the Company’s consolidated balance sheets. The repurchase program may be suspended or discontinued at any time without notice.
Free historical financial statements for Medpace Holdings Inc. See how revenue, income, cash flow, and balance sheet financials have changed over 33 quarters since 2018. Compare with MEDP stock chart to see long term trends.
Data imported from Medpace Holdings Inc SEC filings. Check original filings before making any investment decision.