Health Care › Industrial Instruments For Measurement, Display, And Control

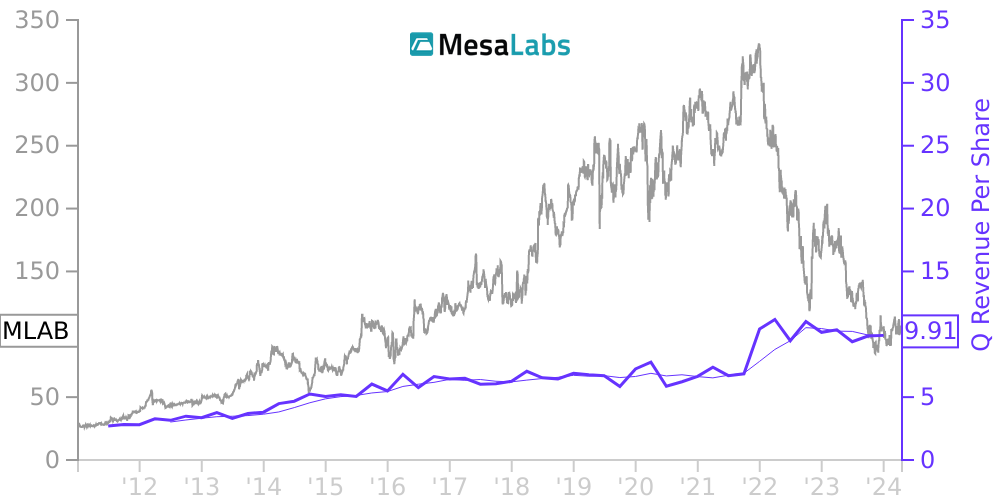
MLAB Stock Price Correlated With Mesa Laboratories Financials
External Links ⌄
Income Statement
Cash Flow
Balance Sheet
MLAB Income Statement
Enable JavaScript and reload
Revenue, Net:
Cost of Goods & Services Sold:
Gross Profit:
Selling, General & Admin Expense:
Research & Development Expense:
Total Operating Expenses:
Operating Income:
Income Taxes:
Net Income:
MLAB Cash Flow
Enable JavaScript and reload
Operating Activities Net Income:
Depreciation, Depletion & Amortization:
Change in Accounts Receiveable:
Net Cash from Operations:
Repurchases/Buybacks Common Stock:
Issuance of Long-term Debt:
Cash Dividends Paid:
Net Cash from Financing Activities:
Property, Plant & Equipment Purchases:
Purchases of Businesses, Net of Cash:
Net Cash from Investing Activities:
Net Change in Cash & Equivalents:
MLAB Balance Sheet
Enable JavaScript and reload
Cash and Cash Equivalents:
Short-Term Investments:
Accounts Receivable, Net:
Inventories:
Total Current Assets:
Property, Plant & Equipment, Net:
Total Assets:
Accounts Payable:
Current Portion of Long-Term Debt:
Total Short-Term Liabilities:
Long Term Debt, Non-Current Portion:
Total Long-Term Liabilities:
Total Liabilities:
COMPANY PROFILE
Note 1. Description of Business and Summary of Significant Accounting Policies
Description of Business
In this Annual Report on Form 10 -K, Mesa Laboratories, Inc., a Colorado corporation, together with its subsidiaries is collectively referred to as “we,” “us,” “our,” the “Company” or “Mesa Labs.”
We are a multinational manufacturer, developer, and seller of quality control products and services, many of which are sold into niche markets that are driven by regulatory requirements. We have manufacturing operations in North America and Europe and our products are marketed by our sales personnel in North America, Europe, and Asia, and by independent distributors in these areas as well as throughout the rest of the world. We prefer markets in which we can establish a strong presence and achieve high gross margins.
As of March 31, 2021, we managed our operations in four reportable segments, or divisions. Our Sterilization and Disinfection Control division manufactures and sells biological, cleaning, and chemical indicators which are used to assess the effectiveness of sterilization and disinfection processes in the hospital, dental, medical device, and pharmaceutical industries. The division also provides testing and laboratory services, mainly to the dental industry. Our Instruments division designs, manufactures, and markets quality control hardware and disposable products utilized in the healthcare, pharmaceutical, food and beverage, medical device, industrial hygiene, and environmental air sampling industries. During the year ended March 31, 2020, we added a new reportable segment: Biopharmaceutical Development as a result of our acquisition of Gyros Protein Technologies Holding AB ("GPT" or the "GPT acquisition"), which is discussed further in Note 4."Significant Transactions." Our Biopharmaceutical Development division develops, manufactures, and sells automated systems for protein analysis (immunoassays) and peptide synthesis solutions. Immunoassays and peptide synthesis solutions accelerate the discovery, development, and manufacturing of biotherapeutic drugs. Our Continuous Monitoring division designs, develops, and markets systems which are used to monitor various environmental parameters such as temperature, humidity, and differential pressure to ensure that critical storage and processing conditions are maintained in hospitals, pharmaceutical and medical device manufacturers, blood banks, pharmacies, and laboratory environments. Non-reportable operating segments (including our Cold Chain Packaging division which ceased operations during the year ended March 31, 2020) and unallocated corporate expenses are reported within Corporate and Other.
Principals of Consolidation and Basis of Presentation Our Consolidated Financial Statements are prepared in accordance with accounting principles generally accepted in the United States (“GAAP”) and include our accounts and wholly owned subsidiaries after elimination of all intercompany accounts and transactions. GPT results are consolidated with Mesa's financial statements beginning November 1, 2019, the first full day following the acquisition. Prior period results have not been recast and are therefore not comparable with the year ending March 31, 2021.
Management Estimates The preparation of our Consolidated Financial Statements in conformity with GAAP requires us to make estimates and assumptions that affect the reported amounts of assets, liabilities, revenues and expenses and the disclosure of contingent assets and liabilities in our Consolidated Financial Statements and accompanying notes. Actual results could differ from our estimates under different assumptions or conditions.
Summary of Significant Accounting Policies
Foreign Currency Exchange rate adjustments resulting from foreign currency transactions are recognized in net earnings, whereas effects resulting from the translation of financial statements are reflected as a component of accumulated other comprehe
Free historical financial statements for Mesa Laboratories Inc. See how revenue, income, cash flow, and balance sheet financials have changed over 60 quarters since 2011. Compare with MLAB stock chart to see long term trends.
Data imported from Mesa Laboratories Inc SEC filings. Check original filings before making any investment decision.