Financials › Surety Insurance

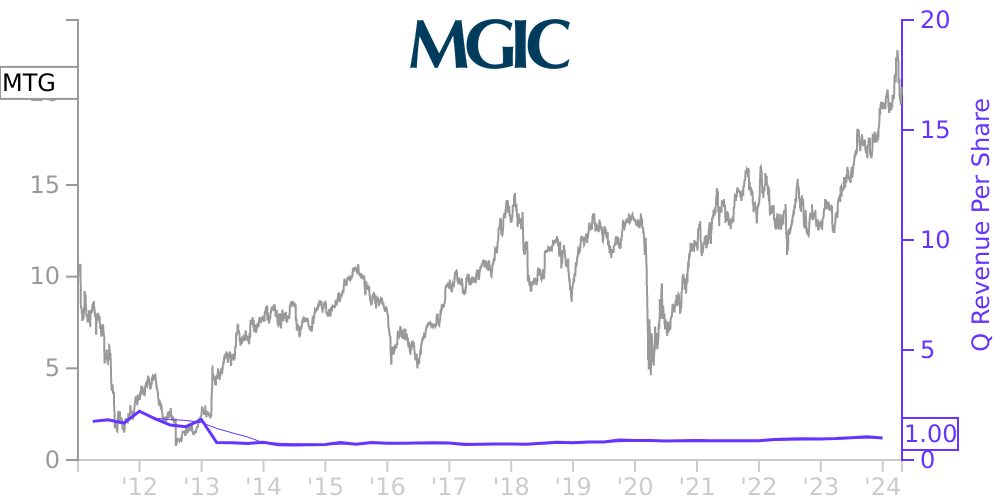
MTG Stock Price Correlated With MGIC Investment Financials
External Links ⌄
Income Statement
Cash Flow
Balance Sheet
MTG Income Statement
Enable JavaScript and reload
Revenue, Net:
Cost of Goods & Services Sold:
Gross Profit:
Selling, General & Admin Expense:
Research & Development Expense:
Total Operating Expenses:
Operating Income:
Income Taxes:
Net Income:
MTG Cash Flow
Enable JavaScript and reload
Operating Activities Net Income:
Depreciation, Depletion & Amortization:
Change in Accounts Receiveable:
Net Cash from Operations:
Repurchases/Buybacks Common Stock:
Issuance of Long-term Debt:
Cash Dividends Paid:
Net Cash from Financing Activities:
Property, Plant & Equipment Purchases:
Purchases of Businesses, Net of Cash:
Net Cash from Investing Activities:
Net Change in Cash & Equivalents:
MTG Balance Sheet
Enable JavaScript and reload
Cash and Cash Equivalents:
Short-Term Investments:
Accounts Receivable, Net:
Inventories:
Total Current Assets:
Property, Plant & Equipment, Net:
Total Assets:
Accounts Payable:
Current Portion of Long-Term Debt:
Total Short-Term Liabilities:
Long Term Debt, Non-Current Portion:
Total Long-Term Liabilities:
Total Liabilities:
COMPANY PROFILE
NOTE 2 Basis of Presentation
BASIS OF PRESENTATION
The accompanying consolidated financial statements have been prepared in accordance with accounting principles generally accepted in the United States of America ("GAAP"), as codified in the Accounting Standards Codification ("ASC"). Our consolidated financial statements include the accounts of MGIC Investment Corporation and its majority-owned subsidiaries. Intercompany transactions and balances have been eliminated. In accordance with GAAP, we are required to make estimates and assumptions that affect the reported amounts of assets and liabilities and disclosure of contingent assets and liabilities at the date of the consolidated financial statements and the reported amounts of revenues and expenses during the reporting periods. Actual results could differ from those estimates.
The COVID-19 pandemic had a material impact on our 2020 financial results. While uncertain, the impact of the COVID-19 pandemic on the Company’s future financial results, business, liquidity and/or financial condition may also be material. The magnitude of the impact will be influenced by various factors, including the length and severity of the pandemic in the United States, efforts to reduce the transmission of COVID-19, the level of unemployment, and the impact of government initiatives and actions taken by Fannie Mae and Freddie Mac (the "GSEs") (including mortgage forbearance and modification programs) to mitigate the economic harm caused by COVID-19.
SUBSEQUENT EVENTS
We have considered subsequent events through the date of this filing.
Free historical financial statements for MGIC Investment Corp.. See how revenue, income, cash flow, and balance sheet financials have changed over 61 quarters since 2011. Compare with MTG stock chart to see long term trends.
Data imported from MGIC Investment Corp. SEC filings. Check original filings before making any investment decision.