Financials › Security And Commodity Brokers, Dealers, Exchanges And Services

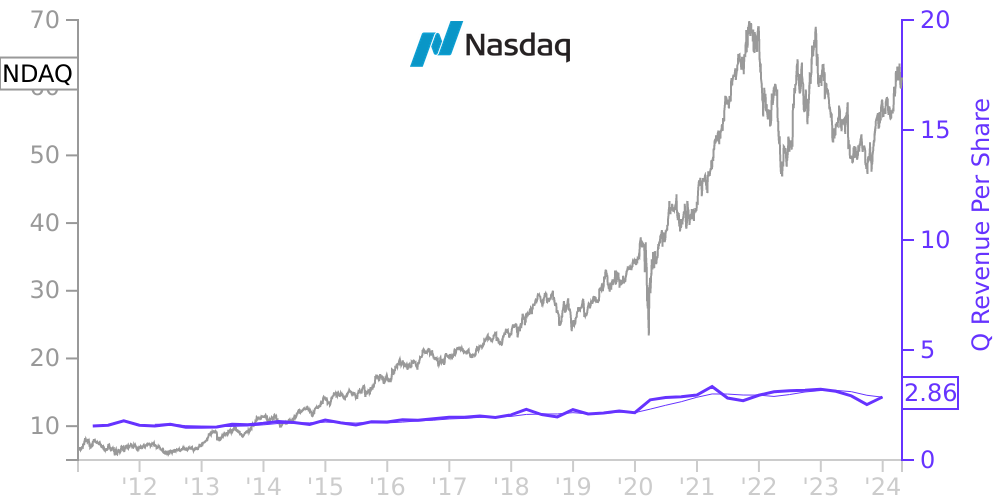
NDAQ Stock Price Correlated With Nasdaq Financials
External Links ⌄
Income Statement
Cash Flow
Balance Sheet
NDAQ Income Statement
Enable JavaScript and reload
Revenue, Net:
Cost of Goods & Services Sold:
Gross Profit:
Selling, General & Admin Expense:
Research & Development Expense:
Total Operating Expenses:
Operating Income:
Income Taxes:
Net Income:
NDAQ Cash Flow
Enable JavaScript and reload
Operating Activities Net Income:
Depreciation, Depletion & Amortization:
Change in Accounts Receiveable:
Net Cash from Operations:
Repurchases/Buybacks Common Stock:
Issuance of Long-term Debt:
Cash Dividends Paid:
Net Cash from Financing Activities:
Property, Plant & Equipment Purchases:
Purchases of Businesses, Net of Cash:
Net Cash from Investing Activities:
Net Change in Cash & Equivalents:
NDAQ Balance Sheet
Enable JavaScript and reload
Cash and Cash Equivalents:
Short-Term Investments:
Accounts Receivable, Net:
Inventories:
Total Current Assets:
Property, Plant & Equipment, Net:
Total Assets:
Accounts Payable:
Current Portion of Long-Term Debt:
Total Short-Term Liabilities:
Long Term Debt, Non-Current Portion:
Total Long-Term Liabilities:
Total Liabilities:
COMPANY PROFILE
Basis of Presentation and Principles of Consolidation
The consolidated financial statements are prepared in accordance with U.S. GAAP. The financial statements include the accounts of NASDAQ OMX, its wholly-owned subsidiaries and other entities in which NASDAQ OMX has a controlling financial interest. All significant intercompany accounts and transactions have been eliminated in consolidation. When we do not have a controlling interest in an entity but exercise significant influence over the entity’s operating and financial policies, such investment is accounted for under the equity method of accounting. We recognize our share of earnings or losses of an equity method investee based on our ownership percentage. As permitted under U.S. GAAP, for certain equity method investments for which financial information is not sufficiently timely for us to apply the equity method of accounting currently, we record our share of the earnings or losses of the investee from the most recently available financial statements on a lag. See Note 6, “Investments,” for further discussion of our equity method investments.
Changes in Reportable Segments and Reclassifications
Since January 1, 2013, we manage, operate and provide our products and services in four business segments: Market Services, Listing Services, Information Services and Technology Solutions. All prior period segment disclosures have been recast to reflect our change in reportable segments. See Note 19, “Business Segments,” for additional information about our segments .
Prior to January 1, 2013, we managed, operated and provided our products and services in three business segments: Market Services, Issuer Services and Market Technology.
Certain other prior year amounts have been reclassified to conform to the current year presentation.
Subsequent Events
We have evaluated subsequent events through the issuance date of this Annual Report on Form 10-K.
Free historical financial statements for Nasdaq Inc. See how revenue, income, cash flow, and balance sheet financials have changed over 61 quarters since 2011. Compare with NDAQ stock chart to see long term trends.
Data imported from Nasdaq Inc SEC filings. Check original filings before making any investment decision.