Health Care › Surgical & Medical Instruments & Apparatus

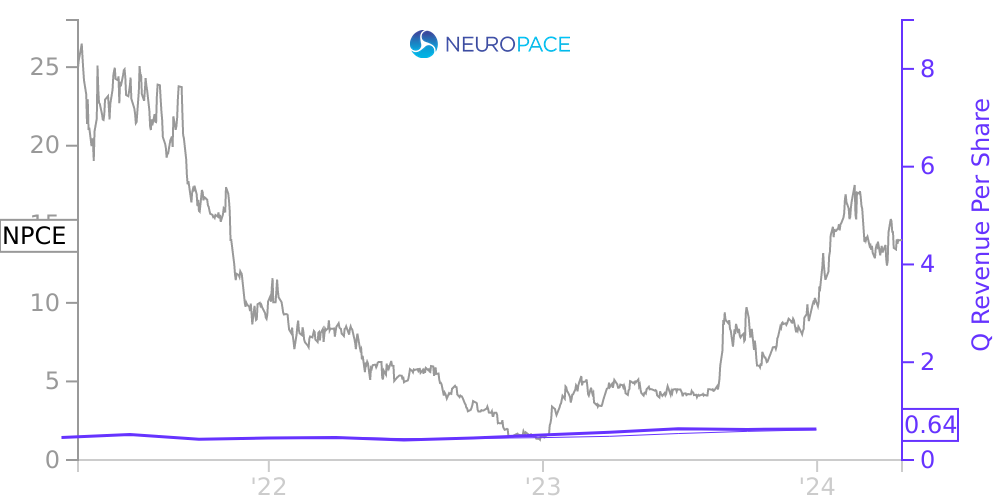
NPCE Stock Price Correlated With NeuroPace Financials
External Links ⌄
Income Statement
Cash Flow
Balance Sheet
NPCE Income Statement
Enable JavaScript and reload
Revenue, Net:
Cost of Goods & Services Sold:
Gross Profit:
Selling, General & Admin Expense:
Research & Development Expense:
Total Operating Expenses:
Operating Income:
Income Taxes:
Net Income:
NPCE Cash Flow
Enable JavaScript and reload
Operating Activities Net Income:
Depreciation, Depletion & Amortization:
Change in Accounts Receiveable:
Net Cash from Operations:
Repurchases/Buybacks Common Stock:
Issuance of Long-term Debt:
Cash Dividends Paid:
Net Cash from Financing Activities:
Property, Plant & Equipment Purchases:
Purchases of Businesses, Net of Cash:
Net Cash from Investing Activities:
Net Change in Cash & Equivalents:
NPCE Balance Sheet
Enable JavaScript and reload
Cash and Cash Equivalents:
Short-Term Investments:
Accounts Receivable, Net:
Inventories:
Total Current Assets:
Property, Plant & Equipment, Net:
Total Assets:
Accounts Payable:
Current Portion of Long-Term Debt:
Total Short-Term Liabilities:
Long Term Debt, Non-Current Portion:
Total Long-Term Liabilities:
Total Liabilities:
COMPANY PROFILE
The Company NeuroPace, Inc., or the Company, was incorporated in the state of Delaware on November 19, 1997. The Company is a commercial-stage medical device company that has developed the RNS System, the only commercially available brain-responsive neuromodulation system designed for treating medically refractory focal epilepsy by delivering personalized, real-time treatment at the seizure source. The Company began commercializing its products in the United States in 2014.
Initial Public Offering
On April 21, 2021, the Company’s registration statement on Form S-1 (File No. 333-254663) relating to its initial public offering, or IPO, of common stock became effective. The IPO closed on April 26, 2021, at which time the Company issued 6,900,000 shares of its common stock at a price of $17.00 per share, which included the issuance of shares in connection with the exercise by the underwriters of their option to purchase up to 900,000 additional shares. The Company received an aggregate of $117.3 million in gross proceeds, before underwriting discounts and commissions and offering costs, and approximately $105.5 million in net proceeds after deducting $8.2 million in underwriting discounts and commissions and $3.6 million in offering costs.
Upon the closing of the IPO, all outstanding shares of the Company’s redeemable convertible preferred stock converted into 16,614,178 shares of common stock, warrants to purchase 346,823 shares of Series B’ convertible preferred stock net exercised to 213,941 shares of Series B’ convertible preferred stock and subsequently converted into common stock on a one-to-one basis, and warrants to purchase 219 shares of common stock net exercised to 185 shares of common stock. In connection with the completion of its IPO, on April 26, 2021, the Company’s certificate of incorporation was amended and restated to provide for 200,000,000 authorized shares of common stock with a par value of $0.001 per share and 10,000,000 authorized shares of preferred stock with a par value of $0.001 per share.
Liquidity and Capital Resources
The Company has incurred operating losses and negative cash flows from operations since its inception and has an accumulated deficit of $435.2 million as of March 31, 2022. For the three months ended March 31, 2022 and 2021, the Company used $11.4 million and $5.9 million of cash, respectively, in its operating activities. As of March 31, 2022, the Company had cash, cash equivalents and short-term investments of $103.2 million. Historically, the Company has funded its operations principally through the sales of its products, issuance of redeemable convertible preferred stock and debt financing. On April 26, 2021, the Company completed its IPO and received approximately $105.5 million in net proceeds after deducting underwriting discounts, commissions and offering costs.
The Company’s condensed financial statements have been prepared on the basis of the Company continuing as a going concern for the next 12 months. Management believes that the Company’s cash, cash equivalents and short-term investments will allow the Company to continue its planned operations for at least the next 12 months from the date of the issuance of these unaudited interim condensed financial statements.
In connection with the Term Loan described in Note 6, the Company will need to be in compliance with a minimum annual net revenue covenant determined in accordance with generally accepted accounting principles of $43.0 million in the year ended December 31, 2022, and maintain a minimum cash and cash equivalents balance of $5.0 million . If the Company cannot generate sufficient revenue in the future, the Company may not be in compliance with the annual net revenue covenant and the lender may call the debt resulting in the Company immediately needing additional funds, and resulting in a going concern. As of March 31, 2022 , the Company was in compliance with all covenants of the Term Loan.
The COVID-19 pand
Free historical financial statements for NeuroPace Inc.. See how revenue, income, cash flow, and balance sheet financials have changed over 21 quarters since 2021. Compare with NPCE stock chart to see long term trends.
Data imported from NeuroPace Inc. SEC filings. Check original filings before making any investment decision.