Communication › Services-Advertising Agencies

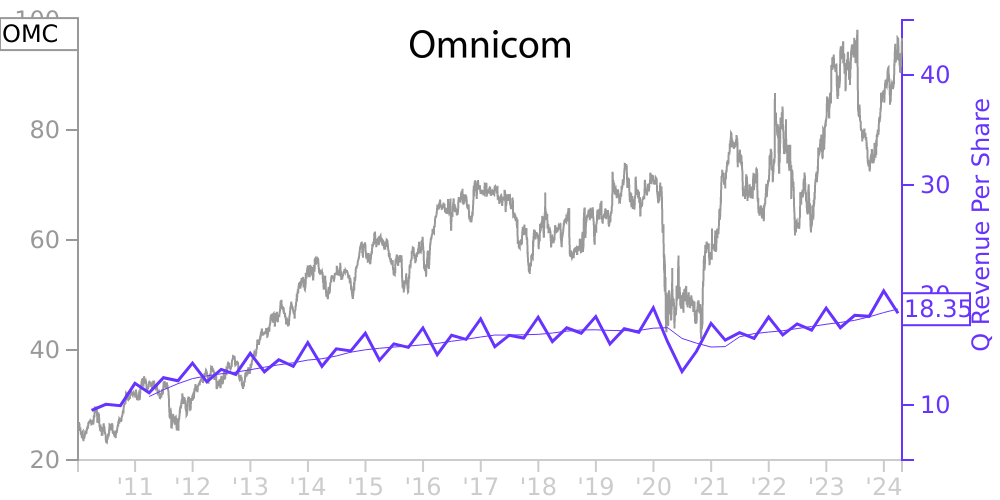
OMC Stock Price Correlated With Omnicom Financials
External Links ⌄
Income Statement
Cash Flow
Balance Sheet
OMC Income Statement
Enable JavaScript and reload
Revenue, Net:
Cost of Goods & Services Sold:
Gross Profit:
Selling, General & Admin Expense:
Research & Development Expense:
Total Operating Expenses:
Operating Income:
Income Taxes:
Net Income:
OMC Cash Flow
Enable JavaScript and reload
Operating Activities Net Income:
Depreciation, Depletion & Amortization:
Change in Accounts Receiveable:
Net Cash from Operations:
Repurchases/Buybacks Common Stock:
Issuance of Long-term Debt:
Cash Dividends Paid:
Net Cash from Financing Activities:
Property, Plant & Equipment Purchases:
Purchases of Businesses, Net of Cash:
Net Cash from Investing Activities:
Net Change in Cash & Equivalents:
OMC Balance Sheet
Enable JavaScript and reload
Cash and Cash Equivalents:
Short-Term Investments:
Accounts Receivable, Net:
Inventories:
Total Current Assets:
Property, Plant & Equipment, Net:
Total Assets:
Accounts Payable:
Current Portion of Long-Term Debt:
Total Short-Term Liabilities:
Long Term Debt, Non-Current Portion:
Total Long-Term Liabilities:
Total Liabilities:
COMPANY PROFILE
Presentation of Financial Statements The terms “Omnicom,” “the Company,” “we,” “our” and “us” each refer to Omnicom Group Inc. and its subsidiaries, unless the context indicates otherwise. The accompanying consolidated financial statements were prepared in accordance with generally accepted accounting principles in the United States, or U.S. GAAP or GAAP. All intercompany balances and transactions have been eliminated.
We prepare our financial statements in conformity with U.S. GAAP and are required to make estimates and assumptions that affect the amounts reported in the consolidated financial statements and accompanying notes. Actual results could differ from those estimates and assumptions.
Impact of the COVID-19 Pandemic on our Business
As the impact of the COVID-19 pandemic on the global economy moderated, we experienced an improvement in our business in 2021 as compared to 2020. In 2021, revenue increased $1,118.3 million, or 8.5%, compared to 2020. The increase in revenue primarily reflects increased client spending in all our disciplines and across all our geographic areas compared to the prior year period and the strengthening of most foreign currencies, primarily the British Pound and the Euro, against the U.S. Dollar. The increase in revenue year-over-year was partially offset by a reduction in acquisition revenue, net of disposition revenue, reflecting the sale of our wholly owned subsidiary ICON International, or ICON, a specialty media business, in the second quarter of 2021.
Global economic conditions may continue to be volatile as long as the COVID-19 pandemic remains a public health threat, which could negatively impact our clients’ spending plans. We expect global economic performance and the performance of our businesses to vary by geography and discipline until the impact of the COVID-19 pandemic on the global economy subsides.
In response to the impact of the COVID-19 pandemic, in the second quarter of 2020, we took actions to align our cost structure and reduce our workforce and facility requirements. As a result, we recorded a pre-tax charge of $277.9 million, which was partially offset by the benefit related to pandemic relief reimbursements of $162.6 million under government programs in several countries.
Accounting Changes
On January 1, 2021, we adopted FASB ASU 2019-12, Income Taxes (Topic 740), or ASU 2019-12, which, among other things, amended the rules for recognizing deferred taxes for investments, performing intra-period tax allocations and calculating income taxes in interim periods and reduced complexity in certain areas, including the accounting for transactions that result in a step-up in the tax basis of goodwill and allocating taxes to members of a consolidated group. The adoption of ASU 2019-12 did not have a material effect on our results of operations and financial position.
Free historical financial statements for Omnicom Group Inc. See how revenue, income, cash flow, and balance sheet financials have changed over 65 quarters since 2010. Compare with OMC stock chart to see long term trends.
Data imported from Omnicom Group Inc SEC filings. Check original filings before making any investment decision.