Health Care › Wholesale-Medical, Dental And Hospital Equipment And Supplies

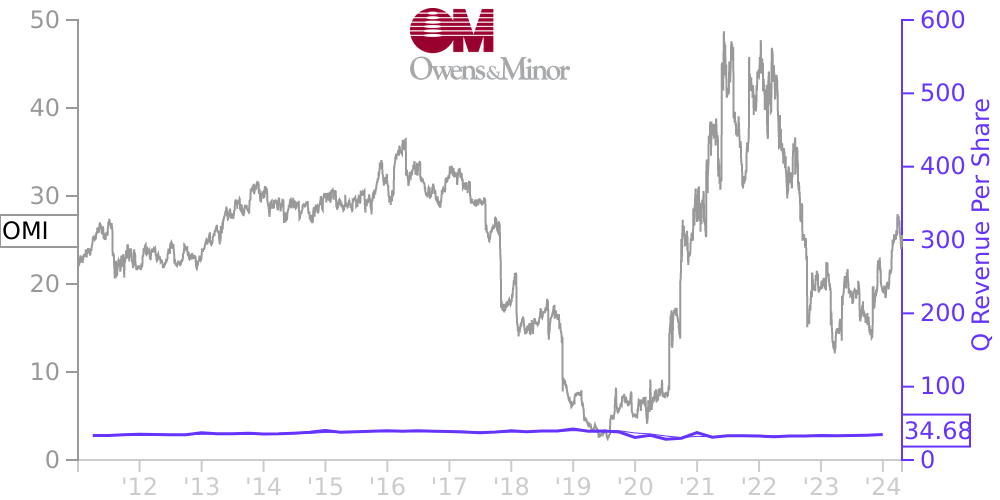
OMI Stock Price Correlated With Owens & Minor Financials
External Links ⌄
Income Statement
Cash Flow
Balance Sheet
OMI Income Statement
Enable JavaScript and reload
Revenue, Net:
Cost of Goods & Services Sold:
Gross Profit:
Selling, General & Admin Expense:
Research & Development Expense:
Total Operating Expenses:
Operating Income:
Income Taxes:
Net Income:
OMI Cash Flow
Enable JavaScript and reload
Operating Activities Net Income:
Depreciation, Depletion & Amortization:
Change in Accounts Receiveable:
Net Cash from Operations:
Repurchases/Buybacks Common Stock:
Issuance of Long-term Debt:
Cash Dividends Paid:
Net Cash from Financing Activities:
Property, Plant & Equipment Purchases:
Purchases of Businesses, Net of Cash:
Net Cash from Investing Activities:
Net Change in Cash & Equivalents:
OMI Balance Sheet
Enable JavaScript and reload
Cash and Cash Equivalents:
Short-Term Investments:
Accounts Receivable, Net:
Inventories:
Total Current Assets:
Property, Plant & Equipment, Net:
Total Assets:
Accounts Payable:
Current Portion of Long-Term Debt:
Total Short-Term Liabilities:
Long Term Debt, Non-Current Portion:
Total Long-Term Liabilities:
Total Liabilities:
COMPANY PROFILE
Summary of Significant Accounting Policies Basis of Presentation
The accompanying unaudited consolidated financial statements include the accounts of Owens & Minor, Inc. and the subsidiaries it controls (we, us, our or the Company) and contain all adjustments (which are comprised only of normal recurring accruals and use of estimates) necessary to conform with U.S. generally accepted accounting principles (GAAP). All significant intercompany accounts and transactions have been eliminated. The results of operations for interim periods are not necessarily indicative of the results expected for the full year.
To better reflect how we go to market as well as certain changes to the leadership team, organizational structure, budgeting and financial reporting processes which drive changes to segment reporting, we have organized our business into two distinct segments: Products & Healthcare Services and Patient Direct. Products & Healthcare Services provides distribution, outsourced logistics and value-added services, and manufactures and sources medical surgical products through our production and kitting operations. Patient Direct expands our business along the continuum of care through delivery of disposable medical supplies sold directly to patients and home health agencies and is a leading provider of integrated home healthcare equipment and related services in the United States. Beginning with the quarter ended March 31, 2022, we now report financial results using this two segment structure and have recast prior year segment results on the same basis.
On March 29, 2022, we completed the acquisition of 100% of Apria, Inc. pursuant to the Agreement and Plan of Merger dated January 7, 2022, in exchange for approximately $1.7 billion, net of cash acquired. Refer to Note 3 for additional details.
Reclassifications
Certain prior year amounts have been reclassified to conform to the current year presentation.
Use of Estimates
The preparation of consolidated financial statements in conformity with GAAP requires us to make assumptions and estimates that affect reported amounts and related disclosures. Actual results may differ from these estimates.
Cash, Cash Equivalents and Restricted Cash
Cash, cash equivalents and restricted cash includes cash and marketable securities with an original maturity or maturity at acquisition of three months or less. Cash, cash equivalents and restricted cash are stated at cost. Nearly all of our cash, cash equivalents and restricted cash are held in cash depository accounts in major banks in the United States, Europe, and Asia. Cash that is held by a major bank and has restrictions on its availability to us is classified as restricted cash. Restricted cash included in Other assets, net as of March 31, 2022 and December 31, 2021 primarily represents cash held in an escrow account as required by the Centers for Medicare & Medicaid Services (CMS) in conjunction with the Bundled Payments for Care Improvement (BPCI) initiatives related to wind-down costs of Fusion5.
The following table provides a reconciliation of cash, cash equivalents and restricted cash reported within the accompanying consolidated balance sheets that sum to the total of those same amounts presented in the accompanying consolidated statements of cash flows.
March 31, 2022 December 31, 2021 Cash and cash equivalents $ 211,298 $ 55,712 Restricted cash included in Other assets, net 16,725 16,323 Total cash, cash equivalents, and restricted cash $ 228,023 $ 72,035
Patient Equipment
Patient equipment, which is included within property and equipment, net, is stated at cost less depreciation and reserves for non-recoverable and obsolete patient equipment. Patient equipment consists of medical equipment rented to patients on a month-to-month basis. Patient equipment is generally placed for rent; however, it could also be sold to customers. Once the rented equipment is returned to us, the patient equipment is assessed and repaired as ne
Free historical financial statements for Owens & Minor Inc.. See how revenue, income, cash flow, and balance sheet financials have changed over 61 quarters since 2011. Compare with OMI stock chart to see long term trends.
Data imported from Owens & Minor Inc. SEC filings. Check original filings before making any investment decision.