Health Care › Services-Business Services, Nec

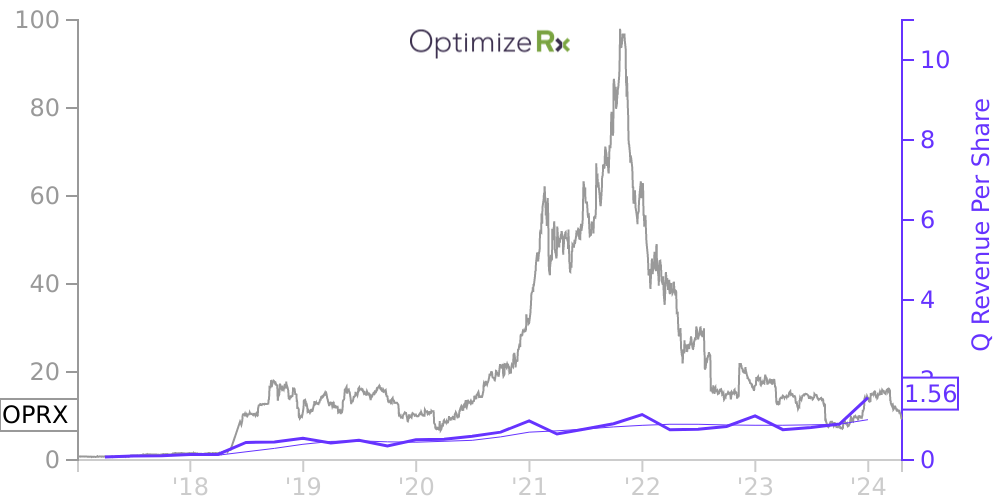
OPRX Stock Price Correlated With OptimizeRx Financials
External Links ⌄
Income Statement
Cash Flow
Balance Sheet
OPRX Income Statement
Enable JavaScript and reload
Revenue, Net:
Cost of Goods & Services Sold:
Gross Profit:
Selling, General & Admin Expense:
Research & Development Expense:
Total Operating Expenses:
Operating Income:
Income Taxes:
Net Income:
OPRX Cash Flow
Enable JavaScript and reload
Operating Activities Net Income:
Depreciation, Depletion & Amortization:
Change in Accounts Receiveable:
Net Cash from Operations:
Repurchases/Buybacks Common Stock:
Issuance of Long-term Debt:
Cash Dividends Paid:
Net Cash from Financing Activities:
Property, Plant & Equipment Purchases:
Purchases of Businesses, Net of Cash:
Net Cash from Investing Activities:
Net Change in Cash & Equivalents:
OPRX Balance Sheet
Enable JavaScript and reload
Cash and Cash Equivalents:
Short-Term Investments:
Accounts Receivable, Net:
Inventories:
Total Current Assets:
Property, Plant & Equipment, Net:
Total Assets:
Accounts Payable:
Current Portion of Long-Term Debt:
Total Short-Term Liabilities:
Long Term Debt, Non-Current Portion:
Total Long-Term Liabilities:
Total Liabilities:
COMPANY PROFILE
NOTE 1 – ORGANIZATION AND NATURE OF BUSINESS OptimizeRx is a digital health technology company
enabling care-focused engagement between life sciences organizations, healthcare providers, and patients at critical junctures throughout
the patient care journey. Connecting over 60% of U.S. healthcare providers and millions of their patients through an intelligent technology
platform embedded within a proprietary point-of-care network, OptimizeRx helps patients start and stay on their medications.
Free historical financial statements for OptimizeRx Corp.. See how revenue, income, cash flow, and balance sheet financials have changed over 37 quarters since 2017. Compare with OPRX stock chart to see long term trends.
Data imported from OptimizeRx Corp. SEC filings. Check original filings before making any investment decision.