Financials › HOSPITAL & MEDICAL SERVICE PLANS

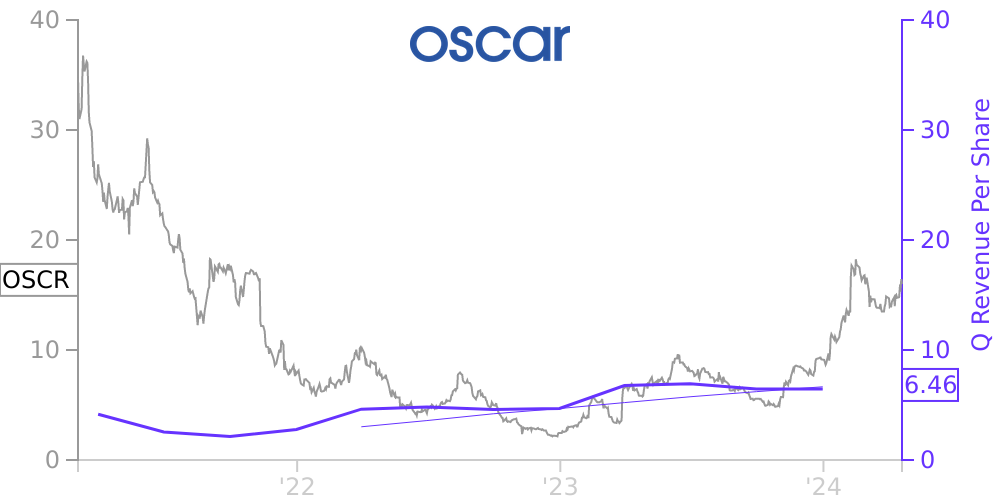
OSCR Stock Price Correlated With Oscar Health Financials
External Links ⌄
Income Statement
Cash Flow
Balance Sheet
OSCR Income Statement
Enable JavaScript and reload
Revenue, Net:
Cost of Goods & Services Sold:
Gross Profit:
Selling, General & Admin Expense:
Research & Development Expense:
Total Operating Expenses:
Operating Income:
Income Taxes:
Net Income:
OSCR Cash Flow
Enable JavaScript and reload
Operating Activities Net Income:
Depreciation, Depletion & Amortization:
Change in Accounts Receiveable:
Net Cash from Operations:
Repurchases/Buybacks Common Stock:
Issuance of Long-term Debt:
Cash Dividends Paid:
Net Cash from Financing Activities:
Property, Plant & Equipment Purchases:
Purchases of Businesses, Net of Cash:
Net Cash from Investing Activities:
Net Change in Cash & Equivalents:
OSCR Balance Sheet
Enable JavaScript and reload
Cash and Cash Equivalents:
Short-Term Investments:
Accounts Receivable, Net:
Inventories:
Total Current Assets:
Property, Plant & Equipment, Net:
Total Assets:
Accounts Payable:
Current Portion of Long-Term Debt:
Total Short-Term Liabilities:
Long Term Debt, Non-Current Portion:
Total Long-Term Liabilities:
Total Liabilities:
COMPANY PROFILE
ORGANIZATION Oscar Health, Inc. ("Oscar" or the "Company") is the first health insurance company built around a full stack technology platform and a relentless focus on serving its members. Headquartered in New York City, Oscar offers two complementary products: (1) innovative and consumer-oriented health plans are sold to Individual, Small Group and Medicare Advantage members and (2) via +Oscar, the Company leverages its technology platform to sell services to providers and payers to directly enable their shift to value-based care.
The Company operates as one segment to sell insurance to its members directly and through the state-run health care exchanges formed in conjunction with the Patient Protection and Affordable Care Act via its health insurance subsidiaries and to sell services via its +Oscar offering. Individual plans are offered to individuals and families through Health Insurance Marketplaces. Small Group plans are offered to employees of companies with 50 - 100 full-time workers. Medicare Advantage plans are offered to adults who are age 65 and older and eligible for traditional Medicare but who instead select coverage through a private market plan. The Company has also partnered with Cigna through the Cigna + Oscar partnership, which unites Oscar’s highly-differentiated member experience with Cigna’s broad provider networks, to exclusively serve the Small Group employer market.
The Company's Class A common stock is traded on the New York Stock Exchange under the symbol "OSCR."
Basis of Presentation
The accompanying interim condensed consolidated financial statements of the Company are unaudited. These interim unaudited condensed consolidated financial statements have been prepared in accordance with U.S. GAAP, and the applicable rules and regulations of the Securities and Exchange Commission for interim financial information. As such, these financial statements do not include all information and footnotes required by U.S. GAAP for complete financial statements.
These condensed consolidated financial statements are unaudited; however, in the opinion of management, they reflect all adjustments consisting only of normal recurring adjustments necessary to state fairly the information presented for the periods presented in conformity with U.S. GAAP applicable to interim periods. The results of operations for the interim periods presented are not necessarily indicative of results for the full year or future periods. These unaudited condensed consolidated financial statements should be read in conjunction with the audited consolidated financial statements and related notes included in the Annual Report on Form 10-K.
Use of Estimates
The preparation of financial statements in conformity with U.S. GAAP requires management to make estimates and assumptions that affect the amounts reported in the consolidated financial statements and accompanying notes. Significant estimates inherent in the preparation of the accompanying interim condensed consolidated financial statements include healthcare costs incurred but not yet reported, premium deficiency reserve and risk adjustment. Estimates are based on past experience and other considerations reasonable under the circumstances. Actual results may differ materially from these estimates.
Free historical financial statements for Oscar Health Inc.. See how revenue, income, cash flow, and balance sheet financials have changed over 21 quarters since 2021. Compare with OSCR stock chart to see long term trends.
Data imported from Oscar Health Inc. SEC filings. Check original filings before making any investment decision.