Health Care › Surgical And Medical Instruments And Apparatus

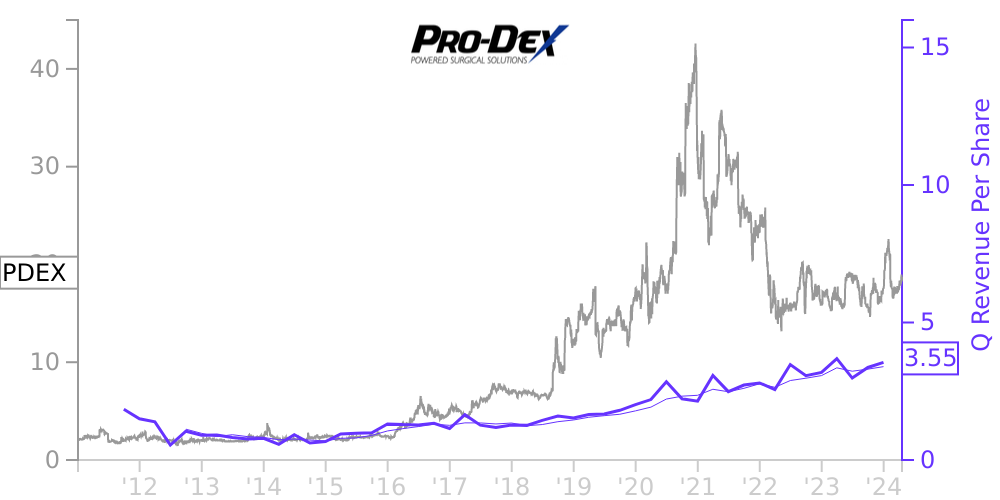
PDEX Stock Price Correlated With Pro-Dex Financials
External Links ⌄
Income Statement
Cash Flow
Balance Sheet
PDEX Income Statement
Enable JavaScript and reload
Revenue, Net:
Cost of Goods & Services Sold:
Gross Profit:
Selling, General & Admin Expense:
Research & Development Expense:
Total Operating Expenses:
Operating Income:
Income Taxes:
Net Income:
PDEX Cash Flow
Enable JavaScript and reload
Operating Activities Net Income:
Depreciation, Depletion & Amortization:
Change in Accounts Receiveable:
Net Cash from Operations:
Repurchases/Buybacks Common Stock:
Issuance of Long-term Debt:
Cash Dividends Paid:
Net Cash from Financing Activities:
Property, Plant & Equipment Purchases:
Purchases of Businesses, Net of Cash:
Net Cash from Investing Activities:
Net Change in Cash & Equivalents:
PDEX Balance Sheet
Enable JavaScript and reload
Cash and Cash Equivalents:
Short-Term Investments:
Accounts Receivable, Net:
Inventories:
Total Current Assets:
Property, Plant & Equipment, Net:
Total Assets:
Accounts Payable:
Current Portion of Long-Term Debt:
Total Short-Term Liabilities:
Long Term Debt, Non-Current Portion:
Total Long-Term Liabilities:
Total Liabilities:
COMPANY PROFILE
NOTE 1. BASIS OF PRESENTATION
The accompanying unaudited condensed consolidated financial statements of Pro-Dex, Inc. ("we", "us", "our", "Pro-Dex" or the "Company") have been prepared in accordance with generally accepted accounting principles for interim financial information and with the instructions to Form 10-Q and Regulation S-K. Accordingly, they do not include all of the information and footnotes required by generally accepted accounting principles for complete financial statements. These financial statements should be read in conjunction with the audited financial statements presented in our Annual Report on Form 10-K for the fiscal year ended June 30, 2011. In the opinion of management, all adjustments considered necessary for a fair presentation have been included. The results of operations for such interim periods are not necessarily indicative of the results that may be expected for the full year. For further information, refer to the consolidated financial statements and footnotes thereto included in our Annual Report on Form 10-K for the year ended June 30, 2011.
Recent Accounting Pronouncements
In May 2011, the Financial Accounting Standards Board ("FASB") issued amended guidance on fair value measurement and related disclosures. The new guidance clarified the concepts applicable for fair value measurement of non-financial assets and requires the disclosure of quantitative information about the unobservable inputs used in a fair value measurement. This guidance will be effective for reporting periods beginning after December 15, 2011, and will be applied prospectively. We are in the process of evaluating the financial and disclosure impact of this guidance. We do not anticipate a material impact on our consolidated financial statements as a result of the adoption of this amended guidance.
In June 2011, the FASB issued amended guidance on the presentation of comprehensive income. The amended guidance eliminates one of the presentation options provided by current U.S. GAAP, that is to present the components of other comprehensive income as part of the statement of changes in stockholders' equity. In addition, it gives an entity the option to present the total of comprehensive income, the components of net income, and the components of other comprehensive income either in a single continuous statement of comprehensive income or in two separate but consecutive statements. This guidance will be effective for reporting periods beginning after December 15, 2011 and will be applied retrospectively. We are in the process of evaluating the disclosure impact of this guidance.
Free historical financial statements for Pro-Dex Inc.. See how revenue, income, cash flow, and balance sheet financials have changed over 59 quarters since 2011. Compare with PDEX stock chart to see long term trends.
Data imported from Pro-Dex Inc. SEC filings. Check original filings before making any investment decision.