Consumer Staples › Beverages

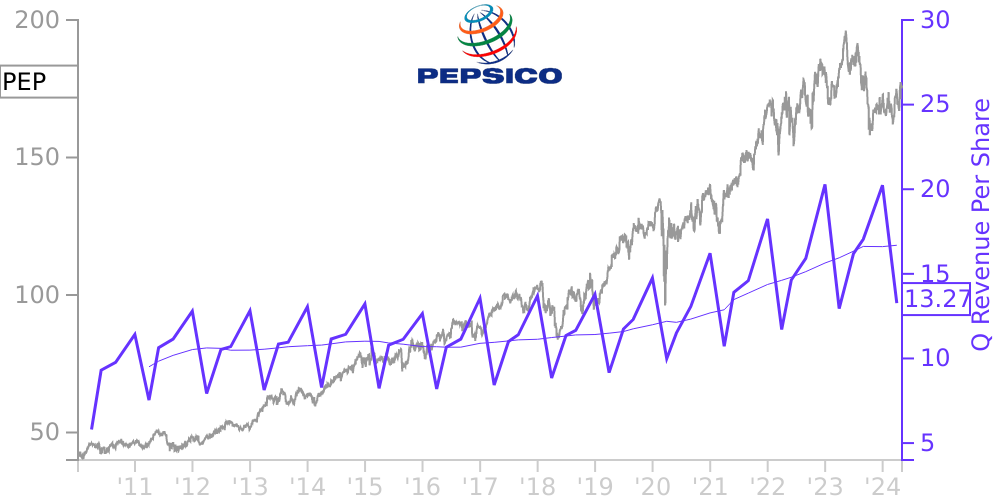
PEP Stock Price Correlated With PepsiCo Financials
External Links ⌄
Income Statement
Cash Flow
Balance Sheet
PEP Income Statement
Enable JavaScript and reload
Revenue, Net:
Cost of Goods & Services Sold:
Gross Profit:
Selling, General & Admin Expense:
Research & Development Expense:
Total Operating Expenses:
Operating Income:
Income Taxes:
Net Income:
PEP Cash Flow
Enable JavaScript and reload
Operating Activities Net Income:
Depreciation, Depletion & Amortization:
Change in Accounts Receiveable:
Net Cash from Operations:
Repurchases/Buybacks Common Stock:
Issuance of Long-term Debt:
Cash Dividends Paid:
Net Cash from Financing Activities:
Property, Plant & Equipment Purchases:
Purchases of Businesses, Net of Cash:
Net Cash from Investing Activities:
Net Change in Cash & Equivalents:
PEP Balance Sheet
Enable JavaScript and reload
Cash and Cash Equivalents:
Short-Term Investments:
Accounts Receivable, Net:
Inventories:
Total Current Assets:
Property, Plant & Equipment, Net:
Total Assets:
Accounts Payable:
Current Portion of Long-Term Debt:
Total Short-Term Liabilities:
Long Term Debt, Non-Current Portion:
Total Long-Term Liabilities:
Total Liabilities:
COMPANY PROFILE
Basis of Presentation and Our Divisions Basis of Presentation
The accompanying consolidated financial statements have been prepared in accordance with U.S. GAAP and include the consolidated accounts of PepsiCo, Inc. and the affiliates that we control. In addition, we include our share of the results of certain other affiliates using the equity method based on our economic ownership interest, our ability to exercise significant influence over the operating or financial decisions of these affiliates or our ability to direct their economic resources. We do not control these other affiliates, as our ownership in these other affiliates is generally 50% or less. Intercompany balances and transactions are eliminated. As a result of exchange restrictions and other operating restrictions, we do not have control over our Venezuelan subsidiaries. As such, our Venezuelan subsidiaries are not included within our consolidated financial results for any period presented.
Raw materials, direct labor and plant overhead, as well as purchasing and receiving costs, costs directly related to production planning, inspection costs and raw materials handling facilities, are included in cost of sales. The costs of moving, storing and delivering finished product, including merchandising activities, are included in selling, general and administrative expenses.
The preparation of our consolidated financial statements requires us to make estimates and assumptions that affect reported amounts of assets, liabilities, revenues, expenses and disclosure of contingent assets and liabilities. Estimates are used in determining, among other items, sales incentives accruals, tax reserves, share-based compensation, pension and retiree medical accruals, amounts and useful lives for intangible assets and future cash flows associated with impairment testing for indefinite-lived intangible assets, goodwill and other long-lived assets. We evaluate our estimates on an ongoing basis using our historical experience, as well as other factors we believe appropriate under the circumstances, such as current economic conditions, and adjust or revise our estimates as circumstances change. Additionally, the business and economic uncertainty resulting from the COVID-19 pandemic has made such estimates and assumptions more difficult to calculate. As future events and their effect cannot be determined with precision, actual results could differ significantly from those estimates.
Our fiscal year ends on the last Saturday of each December, resulting in a 53 rd reporting week every five or six years, including in our 2022 financial results. While our North America results are reported on a weekly calendar basis, substantially all of our international operations reported on a monthly calendar basis prior to the fourth quarter of 2021, and beginning in the fourth quarter of 2021, all of our international operations report on a monthly calendar basis. This change did not have a material impact on our consolidated financial statements. The following chart details our quarterly reporting schedule for the three years presented:
Quarter United States and Canada International First Quarter 12 weeks January, February Second Quarter 12 weeks March, April and May Third Quarter 12 weeks June, July and August Fourth Quarter 16 weeks September, October, November and December
Unless otherwise noted, tabular dollars are in millions, except per share amounts. All per share amounts reflect common per share amounts, assume dilution unless otherwise noted, and are based on unrounded amounts. Certain reclassifications were made to the prior year’s consolidated financial statements to conform to the current year presentation.
Our Divisions
We are organized into seven reportable segments (also referred to as divisions), as follows:
1) FLNA, which includes our branded convenient food businesses in the United States and Canada;
2) QFNA, which includes our branded convenient food businesses, such as ce
Free historical financial statements for PepsiCo Inc.. See how revenue, income, cash flow, and balance sheet financials have changed over 66 quarters since 2010. Compare with PEP stock chart to see long term trends.
Data imported from PepsiCo Inc. SEC filings. Check original filings before making any investment decision.