Consumer Staples › Soap, Detergent, Cleaning Preparations, Perfumes, Cosmetics

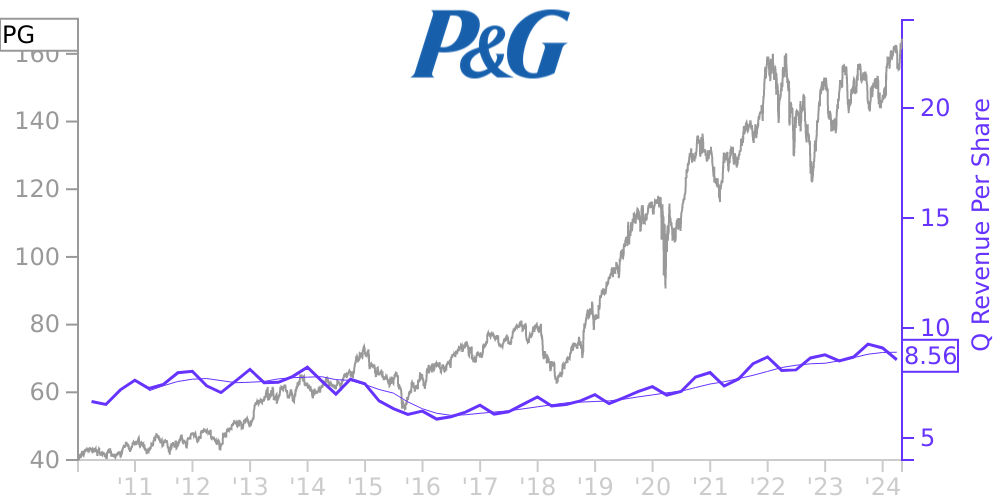
PG Stock Price Correlated With Procter & Gamble Co Financials
External Links ⌄
Income Statement
Cash Flow
Balance Sheet
PG Income Statement
Enable JavaScript and reload
Revenue, Net:
Cost of Goods & Services Sold:
Gross Profit:
Selling, General & Admin Expense:
Research & Development Expense:
Total Operating Expenses:
Operating Income:
Income Taxes:
Net Income:
PG Cash Flow
Enable JavaScript and reload
Operating Activities Net Income:
Depreciation, Depletion & Amortization:
Change in Accounts Receiveable:
Net Cash from Operations:
Repurchases/Buybacks Common Stock:
Issuance of Long-term Debt:
Cash Dividends Paid:
Net Cash from Financing Activities:
Property, Plant & Equipment Purchases:
Purchases of Businesses, Net of Cash:
Net Cash from Investing Activities:
Net Change in Cash & Equivalents:
PG Balance Sheet
Enable JavaScript and reload
Cash and Cash Equivalents:
Short-Term Investments:
Accounts Receivable, Net:
Inventories:
Total Current Assets:
Property, Plant & Equipment, Net:
Total Assets:
Accounts Payable:
Current Portion of Long-Term Debt:
Total Short-Term Liabilities:
Long Term Debt, Non-Current Portion:
Total Long-Term Liabilities:
Total Liabilities:
COMPANY PROFILE
Basis of PresentationThese statements should be read in conjunction with the Company’s Annual Report on Form 10-K for the fiscal year ended June 30, 2022. In the opinion of management, the accompanying unaudited Consolidated Financial Statements of The Procter & Gamble Company and subsidiaries (the "Company," "Procter & Gamble," "P&G," "we" or "our") contain all adjustments necessary to present fairly the financial position, results of operations and cash flows for the interim periods reported. However, the results of operations included in such financial statements may not necessarily be indicative of annual results.
Free historical financial statements for Procter & Gamble Co.. See how revenue, income, cash flow, and balance sheet financials have changed over 67 quarters since 2009. Compare with PG stock chart to see long term trends.
Data imported from Procter & Gamble Co. SEC filings. Check original filings before making any investment decision.