Financials › Fire, Marine And Casualty Insurance

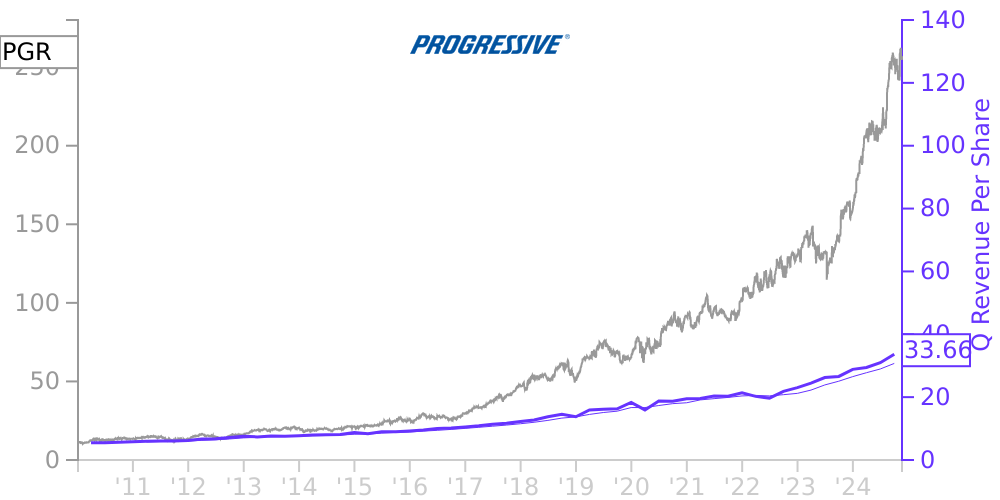
PGR Stock Price Correlated With Progressive Financials
External Links ⌄
Income Statement
Cash Flow
Balance Sheet
PGR Income Statement
Enable JavaScript and reload
Revenue, Net:
Cost of Goods & Services Sold:
Gross Profit:
Selling, General & Admin Expense:
Research & Development Expense:
Total Operating Expenses:
Operating Income:
Income Taxes:
Net Income:
PGR Cash Flow
Enable JavaScript and reload
Operating Activities Net Income:
Depreciation, Depletion & Amortization:
Change in Accounts Receiveable:
Net Cash from Operations:
Repurchases/Buybacks Common Stock:
Issuance of Long-term Debt:
Cash Dividends Paid:
Net Cash from Financing Activities:
Property, Plant & Equipment Purchases:
Purchases of Businesses, Net of Cash:
Net Cash from Investing Activities:
Net Change in Cash & Equivalents:
PGR Balance Sheet
Enable JavaScript and reload
Cash and Cash Equivalents:
Short-Term Investments:
Accounts Receivable, Net:
Inventories:
Total Current Assets:
Property, Plant & Equipment, Net:
Total Assets:
Accounts Payable:
Current Portion of Long-Term Debt:
Total Short-Term Liabilities:
Long Term Debt, Non-Current Portion:
Total Long-Term Liabilities:
Total Liabilities:
COMPANY PROFILE
Basis of Presentation — The accompanying consolidated financial statements include the accounts of The Progressive Corporation, our wholly owned insurance and non-insurance subsidiaries, and affiliates, in which we have a controlling financial interest (Progressive). The consolidated financial statements reflect all normal recurring adjustments that, in the opinion of management, were necessary for a fair statement of the results for the interim periods presented. The results of operations for the period ended March 31, 2022, are not necessarily indicative of the results expected for the full year. These consolidated financial statements and the notes thereto should be read in conjunction with Progressive’s audited financial statements and accompanying notes included in Exhibit 13 to our Annual Report on Form 10-K for the year ended December 31, 2021 (2021 Annual Report to Shareholders).
We perform analyses to evaluate our premiums receivable for expected credit losses. See the 2021 Annual Report to Shareholders for a discussion on our premiums receivable allowance for credit loss policy. The following table summarizes changes in our allowance for credit loss exposure on our premiums receivable:
Three Months Ended March 31, (millions) 2022 2021 Allowance for credit losses, beginning of period $ 280.4 $ 356.2 Increase in allowance 1
93.9 60.9 Write-offs 2
(98.1) (151.8) Allowance for credit losses, end of period $ 276.2 $ 265.3
1 Represents the incremental increase in other underwriting expenses.
2 Represents portion of allowance that is reversed when premiums receivable are written off.
Premium receivable balances are written off once we have exhausted our collection efforts. The higher write-offs during the first quarter 2021, along with experiencing greater collections than anticipated, resulting in part from changes in consumer spending habits and government stimulus spending during the period, contributed to the lower increase in the credit loss allowance taken during the period, compared to the first quarter 2022. During the first quarter 2021, we wrote off premium receivables that were reserved during 2020, when moratoriums and billing leniency efforts were put into place during the novel coronavirus, COVID-19, pandemic. The year-over-year increase in the balance of the allowance for credit losses at March 31, 2022, compared to March 31, 2021, primarily reflects a higher amount of premium receivables determined to be at risk of being uncollectible, driven by the growth in our premiums receivable balance.
Other assets on the consolidated balance sheets include certain long-lived assets that are considered “ held for sale. ” The fair value of these held-for-sale assets, less the estimated costs to sell, was $20.2 million at March 31, 2022, $55.1 million at March 31, 2021, and $10.8 million at December 31, 2021.
Free historical financial statements for Progressive Corp. See how revenue, income, cash flow, and balance sheet financials have changed over 65 quarters since 2010. Compare with PGR stock chart to see long term trends.
Data imported from Progressive Corp SEC filings. Check original filings before making any investment decision.