Financials › Life Insurance

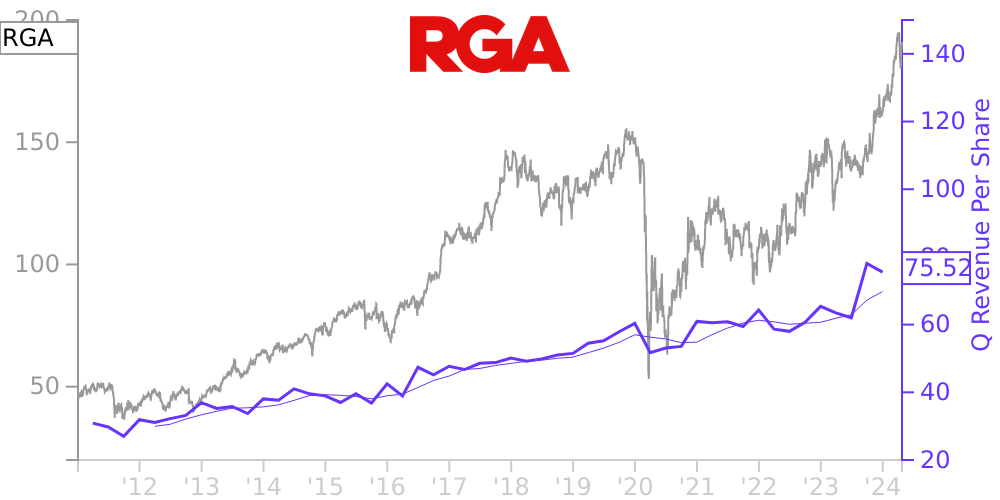
RGA Stock Price Correlated With Reinsurance of America Financials
External Links ⌄
Income Statement
Cash Flow
Balance Sheet
RGA Income Statement
Enable JavaScript and reload
Revenue, Net:
Cost of Goods & Services Sold:
Gross Profit:
Selling, General & Admin Expense:
Research & Development Expense:
Total Operating Expenses:
Operating Income:
Income Taxes:
Net Income:
RGA Cash Flow
Enable JavaScript and reload
Operating Activities Net Income:
Depreciation, Depletion & Amortization:
Change in Accounts Receiveable:
Net Cash from Operations:
Repurchases/Buybacks Common Stock:
Issuance of Long-term Debt:
Cash Dividends Paid:
Net Cash from Financing Activities:
Property, Plant & Equipment Purchases:
Purchases of Businesses, Net of Cash:
Net Cash from Investing Activities:
Net Change in Cash & Equivalents:
RGA Balance Sheet
Enable JavaScript and reload
Cash and Cash Equivalents:
Short-Term Investments:
Accounts Receivable, Net:
Inventories:
Total Current Assets:
Property, Plant & Equipment, Net:
Total Assets:
Accounts Payable:
Current Portion of Long-Term Debt:
Total Short-Term Liabilities:
Long Term Debt, Non-Current Portion:
Total Long-Term Liabilities:
Total Liabilities:
COMPANY PROFILE
BUSINESS AND BASIS OF PRESENTATION Business
Reinsurance Group of America, Incorporated (“RGA”) is an insurance holding company that was formed on December 31, 1992. The consolidated financial statements herein include the assets, liabilities, and results of operations of RGA and its subsidiaries, all of which are wholly owned (collectively, the “Company”).
The Company is engaged in providing traditional reinsurance, which includes individual and group life and health, disability, and critical illness reinsurance. The Company also provides financial solutions, which includes longevity reinsurance, asset-intensive products, primarily annuities, financial reinsurance, capital solutions and stable value products.
Reinsurance is an arrangement under which an insurance company, the reinsurer, agrees to indemnify another insurance company, the ceding company, for all or a portion of the insurance risks underwritten by the ceding company. Reinsurance is designed to:
(i) reduce the net amount at risk on individual risks, thereby enabling the ceding company to increase the volume of business it can underwrite, as well as increase the maximum risk it can underwrite on a single risk;
(ii) enhance the ceding company’s financial strength and surplus position;
(iii) stabilize operating results by leveling fluctuations in the ceding company’s loss experience; and
(iv) assist the ceding company in meeting applicable regulatory requirements.
Basis of Presentation
The consolidated financial statements of the Company have been prepared in accordance with U.S. generally accepted accounting principles (“GAAP”). The preparation of financial statements in conformity with GAAP requires management to make estimates and assumptions that affect the reported amounts of assets and liabilities and the disclosures of contingent assets and liabilities as of the date of the financial statements and the reported amounts of revenues and expenses during the reporting period. The most significant estimates include those used in determining deferred policy acquisition costs, premiums receivable, future policy benefits, incurred but not reported claims, income taxes, valuation of investments and investment impairments, and valuation of embedded derivatives. Actual results could differ materially from the estimates and assumptions used by management.
The accompanying consolidated financial statements include the accounts of RGA and its subsidiaries, all of which are wholly owned, and any variable interest entities where the Company is the primary beneficiary. The Company evaluates variable interest entities in accordance with the general accounting principles for Consolidation . Entities in which the Company has significant influence over the operating and financing decisions but are not required to be consolidated are reported under the equity method of accounting. Intercompany balances and transactions have been eliminated.
There were no subsequent events that would require disclosure or adjustments to the accompanying consolidated financial statements through the date the consolidated financial statements were issued.
Free historical financial statements for Reinsurance Group of America Inc.. See how revenue, income, cash flow, and balance sheet financials have changed over 61 quarters since 2011. Compare with RGA stock chart to see long term trends.
Data imported from Reinsurance Group of America Inc. SEC filings. Check original filings before making any investment decision.