Health Care › Biological Products (No Diagnostic Substances)

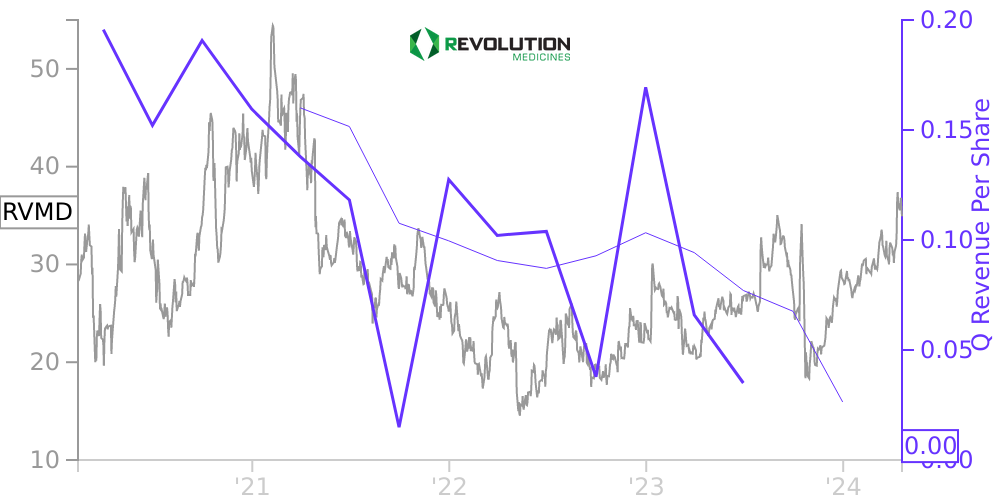
RVMD Stock Price Correlated With REVOLUTION Medicines Financials
External Links ⌄
Income Statement
Cash Flow
Balance Sheet
RVMD Income Statement
Enable JavaScript and reload
Revenue, Net:
Cost of Goods & Services Sold:
Gross Profit:
Selling, General & Admin Expense:
Research & Development Expense:
Total Operating Expenses:
Operating Income:
Income Taxes:
Net Income:
RVMD Cash Flow
Enable JavaScript and reload
Operating Activities Net Income:
Depreciation, Depletion & Amortization:
Change in Accounts Receiveable:
Net Cash from Operations:
Repurchases/Buybacks Common Stock:
Issuance of Long-term Debt:
Cash Dividends Paid:
Net Cash from Financing Activities:
Property, Plant & Equipment Purchases:
Purchases of Businesses, Net of Cash:
Net Cash from Investing Activities:
Net Change in Cash & Equivalents:
RVMD Balance Sheet
Enable JavaScript and reload
Cash and Cash Equivalents:
Short-Term Investments:
Accounts Receivable, Net:
Inventories:
Total Current Assets:
Property, Plant & Equipment, Net:
Total Assets:
Accounts Payable:
Current Portion of Long-Term Debt:
Total Short-Term Liabilities:
Long Term Debt, Non-Current Portion:
Total Long-Term Liabilities:
Total Liabilities:
COMPANY PROFILE
1. Organization
Revolution Medicines, Inc. (the Company) is a clinical-stage precision oncology company focused on developing targeted therapies to inhibit frontier targets in RAS-addicted cancers. The Company was founded in October 2014 and is headquartered in Redwood City, California. Liquidity The Company has incurred net operating losses in each year since inception. As of March 31, 2022, the Company had an accumulated deficit of $ 510.3 million . Management believes that its existing cash, cash equivalents and marketable securities will enable the Company to fund its planned operations for at least 12 months following the issuance date of these condensed consolidated financial statements. The Company has been able to fund its operations through the issuance and sale of common stock and redeemable convertible preferred stock in addition to upfront payments and research and development cost reimbursement received under the Company’s collaboration agreement with Genzyme Corporation, an affiliate of Sanofi. Future capital requirements will depend on many factors, including the timing and extent of spending on research and development and payments the Company may receive under the Sanofi collaboration agreement or future collaboration agreements, if any. There can be no assurance that, in the event the Company requires additional financing, such financing will be available at terms acceptable to the Company, if at all. Failure to generate sufficient cash flows from operations, raise additional capital and reduce discretionary spending should additional capital not become available could have a material adverse effect on the Company’s ability to achieve its business objectives. Public offerings In February 2020, the Company closed its initial public offering (IPO), and issued 16,100,000 shares of its common stock (including the exercise in full by the underwriters of their option to purchase an additional 2,100,000 shares of common stock) at a price to the public of $ 17.00 per share for net proceeds of $ 250.7 million, after deducting underwriting discounts and commissions of $ 19.2 million and expenses of $ 3.8 million. In July 2020, the Company issued and sold 6,900,000 shares of its common stock in an underwritten public offering (including the exercise in full by the underwriters of their option to purchase an additional 900,000 shares of the Company’s common stock) at a price of $ 26.00 per share for net proceeds of $ 167.8 million, after deducting underwriting discounts and commissions of $ 10.8 million and expenses of $ 0.8 million. In February 2021, the Company issued and sold 6,666,666 shares of its common stock in an underwritten public offering (including the exercise in full by the underwriters of their option to purchase an additional 869,565 shares of the Company’s common stock) at a price of $ 45.00 per share for net proceeds of $ 281.1 million, after deducting underwriting discounts and commissions of $ 18.0 million and expenses of $ 0.9 million. In November 2021, the Company entered into a sales agreement with Cowen and Company, LLC (Cowen) to sell shares of its common stock, from time to time, with aggregate gross proceeds of up to $ 250 million, through an at-the-market equity offering program (ATM). In 2021, the Company sold an aggregate of 339,302 shares of common stock under the ATM resulting in gross proceeds of $ 10.4 million. After deducting commissions and expenses of $ 0.3 million, net proceeds to the Company were $ 10.1 million. During the three months ended March 31, 2022, the Company did no t issue shares of the Company’s common stock under the ATM.
Revolution Medicines, Inc. (the Company) is a clinical-stage precision oncology company focused on developing targeted therapies to inhibit frontier targets in RAS-addicted cancers. The Company was founded in October 2014 and is headquartered in Redwood City, California. Liquidity The Company has incurred net operating losses in each year since inception. As of March 31, 2022, the Company had an accumulated deficit of $ 510.3 million . Management believes that its existing cash, cash equivalents and marketable securities will enable the Company to fund its planned operations for at least 12 months following the issuance date of these condensed consolidated financial statements. The Company has been able to fund its operations through the issuance and sale of common stock and redeemable convertible preferred stock in addition to upfront payments and research and development cost reimbursement received under the Company’s collaboration agreement with Genzyme Corporation, an affiliate of Sanofi. Future capital requirements will depend on many factors, including the timing and extent of spending on research and development and payments the Company may receive under the Sanofi collaboration agreement or future collaboration agreements, if any. There can be no assurance that, in the event the Company requires additional financing, such financing will be available at terms acceptable to the Company, if at all. Failure to generate sufficient cash flows from operations, raise additional capital and reduce discretionary spending should additional capital not become available could have a material adverse effect on the Company’s ability to achieve its business objectives. Public offerings In February 2020, the Company closed its initial public offering (IPO), and issued 16,100,000 shares of its common stock (including the exercise in full by the underwriters of their option to purchase an additional 2,100,000 shares of common stock) at a price to the public of $ 17.00 per share for net proceeds of $ 250.7 million, after deducting underwriting discounts and commissions of $ 19.2 million and expenses of $ 3.8 million. In July 2020, the Company issued and sold 6,900,000 shares of its common stock in an underwritten public offering (including the exercise in full by the underwriters of their option to purchase an additional 900,000 shares of the Company’s common stock) at a price of $ 26.00 per share for net proceeds of $ 167.8 million, after deducting underwriting discounts and commissions of $ 10.8 million and expenses of $ 0.8 million. In February 2021, the Company issued and sold 6,666,666 shares of its common stock in an underwritten public offering (including the exercise in full by the underwriters of their option to purchase an additional 869,565 shares of the Company’s common stock) at a price of $ 45.00 per share for net proceeds of $ 281.1 million, after deducting underwriting discounts and commissions of $ 18.0 million and expenses of $ 0.9 million. In November 2021, the Company entered into a sales agreement with Cowen and Company, LLC (Cowen) to sell shares of its common stock, from time to time, with aggregate gross proceeds of up to $ 250 million, through an at-the-market equity offering program (ATM). In 2021, the Company sold an aggregate of 339,302 shares of common stock under the ATM resulting in gross proceeds of $ 10.4 million. After deducting commissions and expenses of $ 0.3 million, net proceeds to the Company were $ 10.1 million. During the three months ended March 31, 2022, the Company did no t issue shares of the Company’s common stock under the ATM.
Free historical financial statements for REVOLUTION Medicines Inc.. See how revenue, income, cash flow, and balance sheet financials have changed over 25 quarters since 2020. Compare with RVMD stock chart to see long term trends.
Data imported from REVOLUTION Medicines Inc. SEC filings. Check original filings before making any investment decision.