Financials › INSURANCE AGENTS BROKERS & SERVICES

RYAN Stock Price Correlated With Ryan Specialty Holdings Financials
External Links ⌄
Income Statement
Cash Flow
Balance Sheet
RYAN Income Statement
Enable JavaScript and reload
Revenue, Net:
Cost of Goods & Services Sold:
Gross Profit:
Selling, General & Admin Expense:
Research & Development Expense:
Total Operating Expenses:
Operating Income:
Income Taxes:
Net Income:
RYAN Cash Flow
Enable JavaScript and reload
Operating Activities Net Income:
Depreciation, Depletion & Amortization:
Change in Accounts Receiveable:
Net Cash from Operations:
Repurchases/Buybacks Common Stock:
Issuance of Long-term Debt:
Cash Dividends Paid:
Net Cash from Financing Activities:
Property, Plant & Equipment Purchases:
Purchases of Businesses, Net of Cash:
Net Cash from Investing Activities:
Net Change in Cash & Equivalents:
RYAN Balance Sheet
Enable JavaScript and reload
Cash and Cash Equivalents:
Short-Term Investments:
Accounts Receivable, Net:
Inventories:
Total Current Assets:
Property, Plant & Equipment, Net:
Total Assets:
Accounts Payable:
Current Portion of Long-Term Debt:
Total Short-Term Liabilities:
Long Term Debt, Non-Current Portion:
Total Long-Term Liabilities:
Total Liabilities:
COMPANY PROFILE
1. Organization
The Company was formed as a Delaware corporation on March 5, 2021. The Company was formed for the purpose of completing an IPO and related transactions in order to carry on the business of Holdings LLC. Subsequent to the IPO and pursuant to the Organizational Transactions, as described in Note 5, Subsequent Events , the Company became the parent and sole managing member of Holdings LLC. As the sole managing member, the Company operates and controls all of the business and affairs of Holdings LLC, and through Holdings LLC and its subsidiaries, conducts its business.
The Company was formed as a Delaware corporation on March 5, 2021. The Company was formed for the purpose of completing an IPO and related transactions in order to carry on the business of Holdings LLC. Subsequent to the IPO and pursuant to the Organizational Transactions, as described in Note 5, Subsequent Events , the Company became the parent and sole managing member of Holdings LLC. As the sole managing member, the Company operates and controls all of the business and affairs of Holdings LLC, and through Holdings LLC and its subsidiaries, conducts its business.
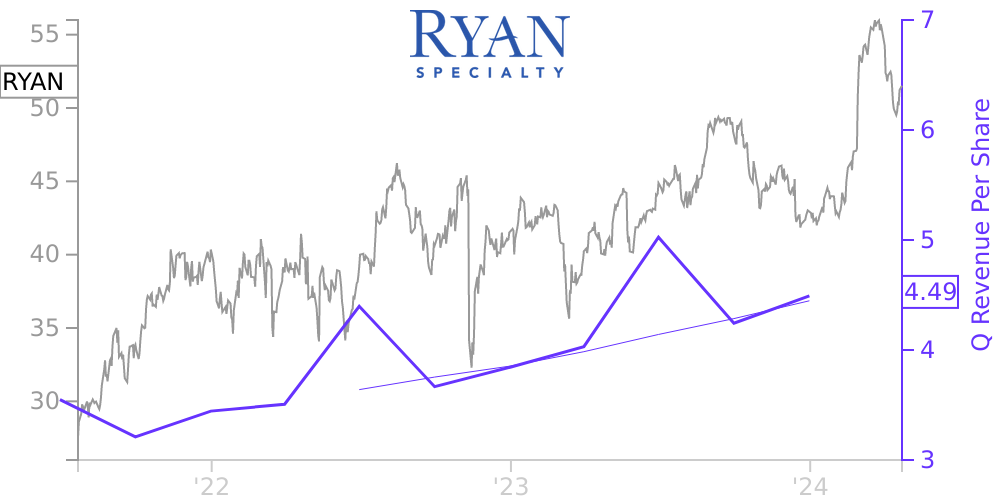
Free historical financial statements for Ryan Specialty Group Holdings Inc.. See how revenue, income, cash flow, and balance sheet financials have changed over 20 quarters since 2021. Compare with RYAN stock chart to see long term trends.
Data imported from Ryan Specialty Group Holdings Inc. SEC filings. Check original filings before making any investment decision.