Financials › Fire, Marine And Casualty Insurance

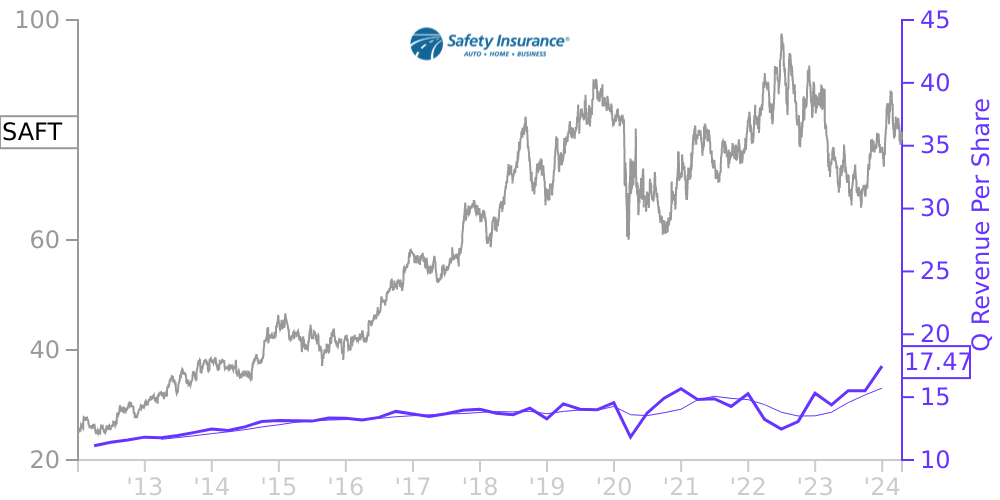
SAFT Stock Price Correlated With Safety Insurance Financials
External Links ⌄
Income Statement
Cash Flow
Balance Sheet
SAFT Income Statement
Enable JavaScript and reload
Revenue, Net:
Cost of Goods & Services Sold:
Gross Profit:
Selling, General & Admin Expense:
Research & Development Expense:
Total Operating Expenses:
Operating Income:
Income Taxes:
Net Income:
SAFT Cash Flow
Enable JavaScript and reload
Operating Activities Net Income:
Depreciation, Depletion & Amortization:
Change in Accounts Receiveable:
Net Cash from Operations:
Repurchases/Buybacks Common Stock:
Issuance of Long-term Debt:
Cash Dividends Paid:
Net Cash from Financing Activities:
Property, Plant & Equipment Purchases:
Purchases of Businesses, Net of Cash:
Net Cash from Investing Activities:
Net Change in Cash & Equivalents:
SAFT Balance Sheet
Enable JavaScript and reload
Cash and Cash Equivalents:
Short-Term Investments:
Accounts Receivable, Net:
Inventories:
Total Current Assets:
Property, Plant & Equipment, Net:
Total Assets:
Accounts Payable:
Current Portion of Long-Term Debt:
Total Short-Term Liabilities:
Long Term Debt, Non-Current Portion:
Total Long-Term Liabilities:
Total Liabilities:
COMPANY PROFILE
1. Basis of Presentatio n The consolidated financial statements have been prepared on the basis of accounting principles generally accepted in the United States of America (“GAAP”). The consolidated financial statements include Safety Insurance Group, Inc. and its subsidiaries (the “Company”). The subsidiaries consist of Safety Insurance Company, Safety Indemnity Insurance Company, Safety Property and Casualty Insurance Company, Safety Northeast Insurance Company, Safety Asset Management Corporation (“SAMC”), and Safety Management Corporation, which is SAMC’s holding company. All intercompany transactions have been eliminated. The Company was incorporated on June 25, 2001 in the State of Delaware. On October 16, 2001, the Company acquired all of the issued and outstanding common stock of Thomas Black Corporation (“TBC”) and its property and casualty subsidiaries. TBC subsequently merged with and into Safety Insurance Group, Inc. with Safety Insurance Group, Inc. being the corporation surviving the merger. The Company is a leading provider of property and casualty insurance focused primarily on the Massachusetts market. The Company’s principal product line is private passenger automobile insurance, which accounted for 53.6% of its direct written premiums in 2021. The Company operates through its insurance company subsidiaries, Safety Insurance Company, Safety Indemnity Insurance Company, Safety Property and Casualty Insurance Company, and Safety Northeast Insurance Company (together referred to as the “Insurance Subsidiaries”). The Insurance Subsidiaries began writing private passenger automobile and homeowners insurance in New Hampshire during 2008, personal umbrella insurance in New Hampshire during 2009, and commercial automobile insurance in New Hampshire during 2011. The Insurance Subsidiaries began writing all of these lines of business in Maine during 2016. Management has assessed and concluded that there were no conditions or events, considered in the aggregate, that raise substantial doubt about the Company’s ability to continue as a going concern within one year after the date the financial statements were issued.
Free historical financial statements for Safety Insurance Group Inc. See how revenue, income, cash flow, and balance sheet financials have changed over 57 quarters since 2012. Compare with SAFT stock chart to see long term trends.
Data imported from Safety Insurance Group Inc SEC filings. Check original filings before making any investment decision.