Consumer Staples › Malt Beverages

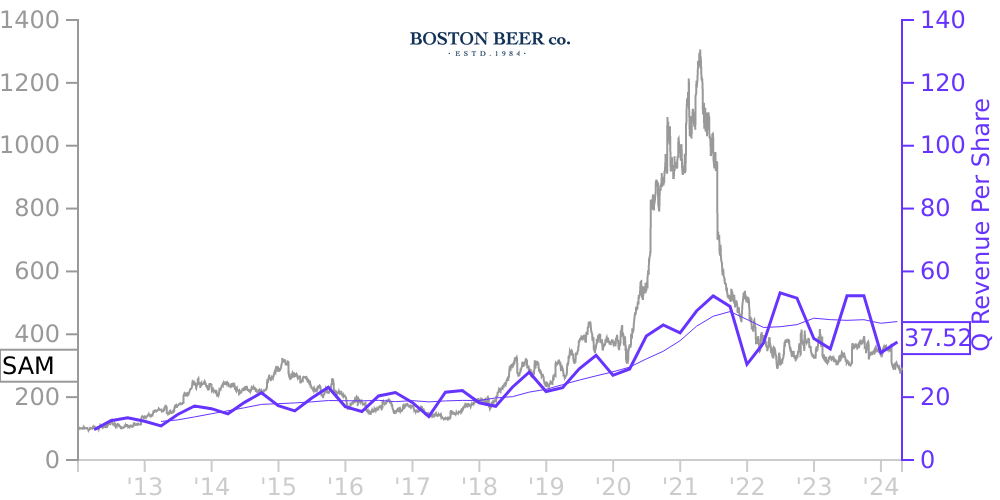
SAM Stock Price Correlated With Boston Beer Co. Financials
External Links ⌄
Income Statement
Cash Flow
Balance Sheet
SAM Income Statement
Enable JavaScript and reload
Revenue, Net:
Cost of Goods & Services Sold:
Gross Profit:
Selling, General & Admin Expense:
Research & Development Expense:
Total Operating Expenses:
Operating Income:
Income Taxes:
Net Income:
SAM Cash Flow
Enable JavaScript and reload
Operating Activities Net Income:
Depreciation, Depletion & Amortization:
Change in Accounts Receiveable:
Net Cash from Operations:
Repurchases/Buybacks Common Stock:
Issuance of Long-term Debt:
Cash Dividends Paid:
Net Cash from Financing Activities:
Property, Plant & Equipment Purchases:
Purchases of Businesses, Net of Cash:
Net Cash from Investing Activities:
Net Change in Cash & Equivalents:
SAM Balance Sheet
Enable JavaScript and reload
Cash and Cash Equivalents:
Short-Term Investments:
Accounts Receivable, Net:
Inventories:
Total Current Assets:
Property, Plant & Equipment, Net:
Total Assets:
Accounts Payable:
Current Portion of Long-Term Debt:
Total Short-Term Liabilities:
Long Term Debt, Non-Current Portion:
Total Long-Term Liabilities:
Total Liabilities:
COMPANY PROFILE
A. Organization and Basis of Presentation The Boston Beer Company, Inc. and certain subsidiaries (the “Company”) are engaged in the business of selling alcohol beverages throughout the United States and in selected international markets, under the trade names “The Boston Beer Company®”, “Twisted Tea Brewing Company®”, “Hard Seltzer Beverage Company”, “Angry Orchard® Cider Company”, “Dogfish Head® Craft Brewery”, “Dogfish Head Distilling Co.”, “Angel City® Brewing Company”, “Coney Island® Brewing Company” and “Bevy Long Drink Co."
Free historical financial statements for Boston Beer Co. Inc.. See how revenue, income, cash flow, and balance sheet financials have changed over 58 quarters since 2012. Compare with SAM stock chart to see long term trends.
Data imported from Boston Beer Co. Inc. SEC filings. Check original filings before making any investment decision.