Health Care › LABORATORY ANALYTICAL INSTRUMENTS

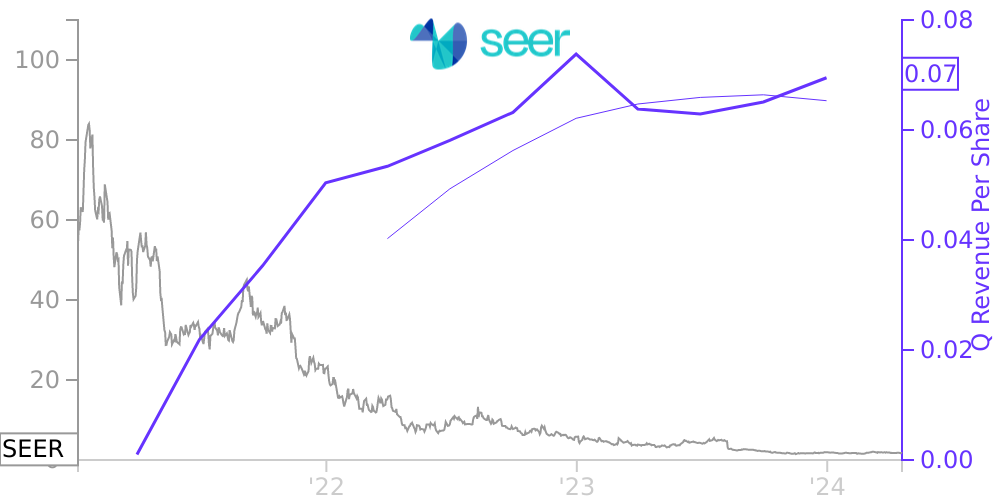
SEER Stock Price Correlated With Seer Financials
External Links ⌄
Income Statement
Cash Flow
Balance Sheet
SEER Income Statement
Enable JavaScript and reload
Revenue, Net:
Cost of Goods & Services Sold:
Gross Profit:
Selling, General & Admin Expense:
Research & Development Expense:
Total Operating Expenses:
Operating Income:
Income Taxes:
Net Income:
SEER Cash Flow
Enable JavaScript and reload
Operating Activities Net Income:
Depreciation, Depletion & Amortization:
Change in Accounts Receiveable:
Net Cash from Operations:
Repurchases/Buybacks Common Stock:
Issuance of Long-term Debt:
Cash Dividends Paid:
Net Cash from Financing Activities:
Property, Plant & Equipment Purchases:
Purchases of Businesses, Net of Cash:
Net Cash from Investing Activities:
Net Change in Cash & Equivalents:
SEER Balance Sheet
Enable JavaScript and reload
Cash and Cash Equivalents:
Short-Term Investments:
Accounts Receivable, Net:
Inventories:
Total Current Assets:
Property, Plant & Equipment, Net:
Total Assets:
Accounts Payable:
Current Portion of Long-Term Debt:
Total Short-Term Liabilities:
Long Term Debt, Non-Current Portion:
Total Long-Term Liabilities:
Total Liabilities:
COMPANY PROFILE
ORGANIZATION AND DESCRIPTION OF THE BUSINESS Seer, Inc. (the Company) was incorporated in Delaware on March 16, 2017, and is headquartered in Redwood City, California. In December 2020, the Company formed the wholly-owned subsidiary, Seer Securities Corporation, located in Massachusetts. The Company is a life sciences company focused on capturing deep molecular insights from the proteome to enable novel insights and breakthroughs in the understanding of biology and disease. Since inception, the Company has devoted its efforts principally to research, development and commercialization of its technology and products, recruiting management and technical staff, acquiring operating assets, and raising capital.
The Company is subject to a number of risks, similar to other early-stage life science companies, including, but not limited to, development and commercialization of its products, market acceptance of its products, development by its competitors of new technological innovations, protection of its intellectual property, and raising additional capital.
Public Offering
On February 1, 2021, the Company completed an underwritten public offering of 1,650,000 shares of its Class A common stock at a public offering price of $67.00 per share. The Company received net proceeds of $103.0 million after deducting offering costs, underwriting discounts, and commissions of $7.6 million.
Liquidity
As of March 31, 2022, the Company has incurred significant losses and has had negative cash flows from operations. As of March 31, 2022, the Company had cash, cash equivalents and investments of $471.8 million and an accumulated deficit of $150.2 million. Management expects to continue to incur significant expenses for the foreseeable future and to incur operating losses in the near term while the Company makes investments to support its anticipated growth. The Company believes that its cash and cash equivalents balance as of March 31, 2022 provides sufficient capital resources to continue its operations for at least 12 months from the issuance date of the accompanying unaudited condensed consolidated financial statements.
Free historical financial statements for Seer Inc.. See how revenue, income, cash flow, and balance sheet financials have changed over 21 quarters since 2021. Compare with SEER stock chart to see long term trends.
Data imported from Seer Inc. SEC filings. Check original filings before making any investment decision.