Health Care › Industrial Instruments For Measurement, Display, And Control

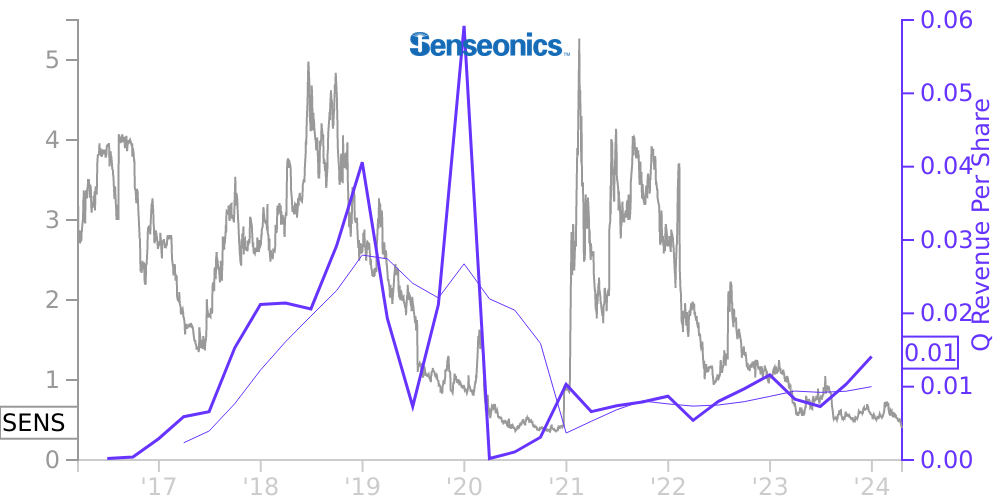
SENS Stock Price Correlated With Senseonics Holdings Financials
External Links ⌄
Income Statement
Cash Flow
Balance Sheet
SENS Income Statement
Enable JavaScript and reload
Revenue, Net:
Cost of Goods & Services Sold:
Gross Profit:
Selling, General & Admin Expense:
Research & Development Expense:
Total Operating Expenses:
Operating Income:
Income Taxes:
Net Income:
SENS Cash Flow
Enable JavaScript and reload
Operating Activities Net Income:
Depreciation, Depletion & Amortization:
Change in Accounts Receiveable:
Net Cash from Operations:
Repurchases/Buybacks Common Stock:
Issuance of Long-term Debt:
Cash Dividends Paid:
Net Cash from Financing Activities:
Property, Plant & Equipment Purchases:
Purchases of Businesses, Net of Cash:
Net Cash from Investing Activities:
Net Change in Cash & Equivalents:
SENS Balance Sheet
Enable JavaScript and reload
Cash and Cash Equivalents:
Short-Term Investments:
Accounts Receivable, Net:
Inventories:
Total Current Assets:
Property, Plant & Equipment, Net:
Total Assets:
Accounts Payable:
Current Portion of Long-Term Debt:
Total Short-Term Liabilities:
Long Term Debt, Non-Current Portion:
Total Long-Term Liabilities:
Total Liabilities:
COMPANY PROFILE
1. Organization and Nature of Operations Senseonics Holdings, Inc., a Delaware corporation, is a medical technology company focused on the development and commercialization of long-term, implantable continuous glucose monitoring (“CGM”) systems to improve the lives of people with diabetes by enhancing their ability to manage their disease with relative ease and accuracy. Senseonics, Incorporated is a wholly owned subsidiary of Senseonics Holdings, Inc. and was originally incorporated on October 30, 1996 and commenced operations on January 15, 1997. Senseonics Holdings, Inc. and Senseonics, Incorporated are hereinafter collectively referred to as the “Company” unless otherwise indicated or the context otherwise requires.
Free historical financial statements for Senseonics Holdings Inc. See how revenue, income, cash flow, and balance sheet financials have changed over 41 quarters since 2016. Compare with SENS stock chart to see long term trends.
Data imported from Senseonics Holdings Inc SEC filings. Check original filings before making any investment decision.