Consumer Staples › Retail-Grocery Stores

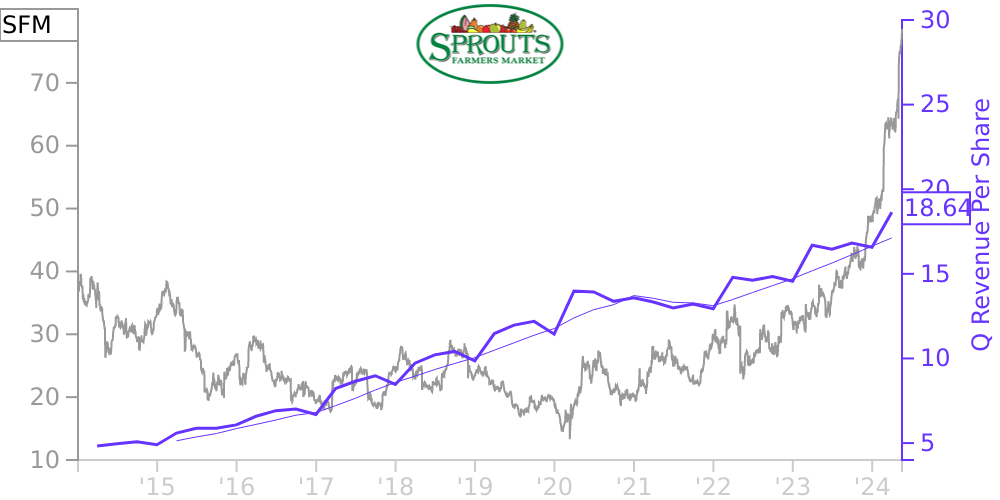
SFM Stock Price Correlated With Sprouts Farmers Market Financials
External Links ⌄
Income Statement
Cash Flow
Balance Sheet
SFM Income Statement
Enable JavaScript and reload
Revenue, Net:
Cost of Goods & Services Sold:
Gross Profit:
Selling, General & Admin Expense:
Research & Development Expense:
Total Operating Expenses:
Operating Income:
Income Taxes:
Net Income:
SFM Cash Flow
Enable JavaScript and reload
Operating Activities Net Income:
Depreciation, Depletion & Amortization:
Change in Accounts Receiveable:
Net Cash from Operations:
Repurchases/Buybacks Common Stock:
Issuance of Long-term Debt:
Cash Dividends Paid:
Net Cash from Financing Activities:
Property, Plant & Equipment Purchases:
Purchases of Businesses, Net of Cash:
Net Cash from Investing Activities:
Net Change in Cash & Equivalents:
SFM Balance Sheet
Enable JavaScript and reload
Cash and Cash Equivalents:
Short-Term Investments:
Accounts Receivable, Net:
Inventories:
Total Current Assets:
Property, Plant & Equipment, Net:
Total Assets:
Accounts Payable:
Current Portion of Long-Term Debt:
Total Short-Term Liabilities:
Long Term Debt, Non-Current Portion:
Total Long-Term Liabilities:
Total Liabilities:
COMPANY PROFILE
2. Basis of Presentation The consolidated financial statements include the accounts of the Company and its wholly owned subsidiaries in accordance with accounting principles generally accepted in the United States of America (“GAAP”). All material intercompany accounts and transactions have been eliminated in consolidation. The Company has one reportable and one operating segment, healthy grocery stores. The Company categorizes the varieties of products it sells as perishable and non-perishable. Perishable product categories include produce, meat, seafood, deli, bakery, floral and dairy and dairy alternatives. Non-perishable product categories include grocery, vitamins and supplements, bulk items, frozen foods, beer and wine, and natural health and body care. The following is a breakdown of the Company’s perishable and non-perishable sales mix:
2021
2020
2019
Perishables
57.7
%
57.2
%
57.7
%
Non-Perishables
42.3
%
42.8
%
42.3
%
All dollar amounts are in thousands, unless otherwise indicated. Certain prior period amounts have been reclassified to conform with the current year presentation.
2021
2020
2019
Perishables
57.7
%
57.2
%
57.7
%
Non-Perishables
42.3
%
42.8
%
42.3
%
All dollar amounts are in thousands, unless otherwise indicated. Certain prior period amounts have been reclassified to conform with the current year presentation.
Free historical financial statements for Sprouts Farmers Market Inc. See how revenue, income, cash flow, and balance sheet financials have changed over 49 quarters since 2014. Compare with SFM stock chart to see long term trends.
Data imported from Sprouts Farmers Market Inc SEC filings. Check original filings before making any investment decision.