Financials › Security And Commodity Brokers, Dealers, Exchanges And Services

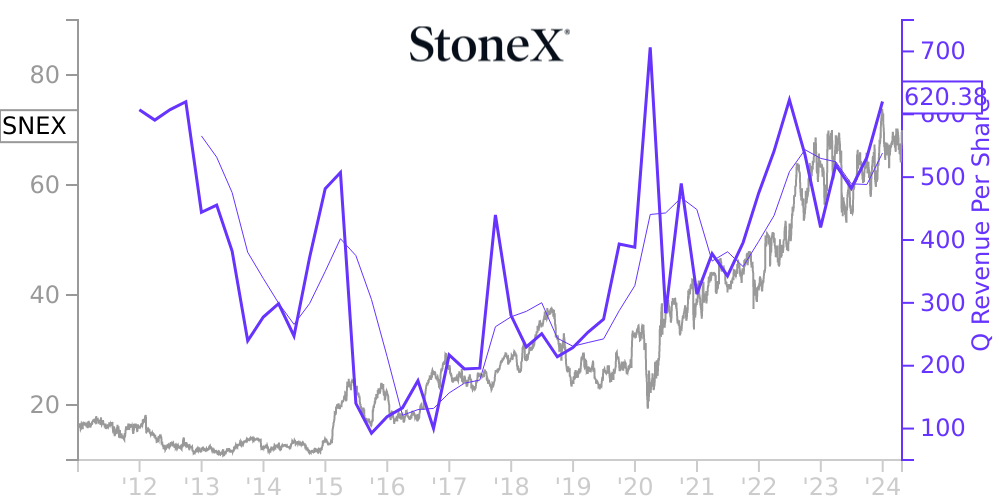
SNEX Stock Price Correlated With StoneX Financials
External Links ⌄
Income Statement
Cash Flow
Balance Sheet
SNEX Income Statement
Enable JavaScript and reload
Revenue, Net:
Cost of Goods & Services Sold:
Gross Profit:
Selling, General & Admin Expense:
Research & Development Expense:
Total Operating Expenses:
Operating Income:
Income Taxes:
Net Income:
SNEX Cash Flow
Enable JavaScript and reload
Operating Activities Net Income:
Depreciation, Depletion & Amortization:
Change in Accounts Receiveable:
Net Cash from Operations:
Repurchases/Buybacks Common Stock:
Issuance of Long-term Debt:
Cash Dividends Paid:
Net Cash from Financing Activities:
Property, Plant & Equipment Purchases:
Purchases of Businesses, Net of Cash:
Net Cash from Investing Activities:
Net Change in Cash & Equivalents:
SNEX Balance Sheet
Enable JavaScript and reload
Cash and Cash Equivalents:
Short-Term Investments:
Accounts Receivable, Net:
Inventories:
Total Current Assets:
Property, Plant & Equipment, Net:
Total Assets:
Accounts Payable:
Current Portion of Long-Term Debt:
Total Short-Term Liabilities:
Long Term Debt, Non-Current Portion:
Total Long-Term Liabilities:
Total Liabilities:
COMPANY PROFILE
Basis of Presentation and Consolidation and Accounting Standards Adopted StoneX Group Inc., a Delaware corporation, and its consolidated subsidiaries (collectively “StoneX” or “the Company”), is a global financial services network that connects companies, organizations, traders and investors to the global market ecosystem through a unique blend of digital platforms, end-to-end clearing and execution services, high touch service, and deep expertise. The Company strives to be the one trusted partner to its clients, providing its network, products and services to allow them to pursue trading opportunities, manage their market risks, make investments and improve their business performance. The Company offers a vertically integrated product suite, beginning with high-touch and electronic access to nearly all major financial markets worldwide, as well as numerous liquidity venues. The Company delivers access and services through the entire lifecycle of a trade, by delivering deep market expertise and on-the-ground intelligence, best execution, and finally post-trade clearing, custody, as well as settlement services. The Company has created revenue streams, diversified by asset class, client type and geography, that earn commissions and spreads as clients execute transactions across its financial network, while monetizing non-trading client activity including interest and fee earnings on client balances as well as earning consulting fees for market intelligence and risk management services.
The Company provides its services to a diverse group of clients in more than 180 countries. These clients include more than 52,000 commercial, institutional, and global payments clients and over 370,000 active retail clients. The Company’s clients include commercial entities, asset managers, regional, national and introducing broker-dealers, insurance companies, brokers, institutional investors and professional traders, commercial and investment banks and government and non-governmental organizations (“NGOs”).
The Company’s common stock trades on The NASDAQ Global Select Market under the symbol “SNEX”.
Basis of Presentation and Consolidation
The accompanying unaudited Condensed Consolidated Balance Sheet as of September 30, 2021, which has been derived from the audited consolidated balance sheet of September 30, 2021, and the unaudited interim condensed consolidated financial statements have been prepared pursuant to the rules and regulations of the Securities and Exchange Commission (“SEC”). Certain information and disclosures normally included in annual consolidated financial statements prepared in accordance with accounting principles generally accepted in the United States of America (“U.S. GAAP”) have been condensed or omitted pursuant to those rules and regulations. The Company believes that the included disclosures clearly and fairly present the information within. In management’s opinion, all adjustments, generally consisting of normal accruals, considered necessary to fairly present the condensed consolidated financial statements for the interim periods presented have been reflected as required by Rule 10-01 of Regulation S-X.
Operating results for interim periods are not necessarily indicative of the results that may be expected for the relevant full year. These condensed consolidated financial statements should be read in conjunction with the Company’s audited consolidated financial statements and related notes contained in the Company’s Annual Report on Form 10-K for the fiscal year ended September 30, 2021, as filed with the SEC.
These condensed consolidated financial statements include the accounts of StoneX Group Inc. and all entities in which the Company has a controlling financial interest. All material intercompany transactions and balances have been eliminated in consolidation.
The Company’s fiscal year end is September 30, and its fiscal quarters end on December 31, March 31, June 30 and September 30. Unless otherwise st
Free historical financial statements for StoneX Group. See how revenue, income, cash flow, and balance sheet financials have changed over 58 quarters since 2011. Compare with SNEX stock chart to see long term trends.
Data imported from StoneX Group SEC filings. Check original filings before making any investment decision.