Health Care › Measuring And Controlling Devices, Nec

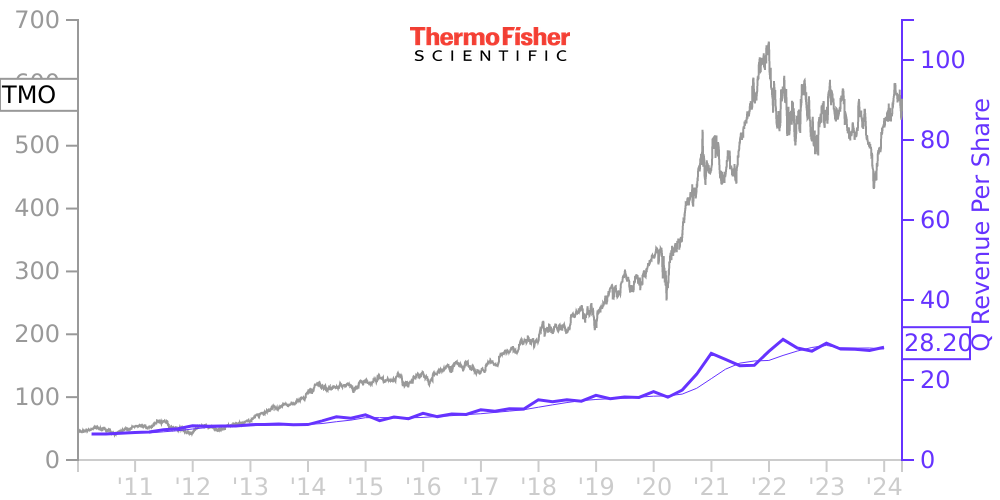
TMO Stock Price Correlated With Thermo Fisher Scientific Financials
External Links ⌄
Income Statement
Cash Flow
Balance Sheet
TMO Income Statement
Enable JavaScript and reload
Revenue, Net:
Cost of Goods & Services Sold:
Gross Profit:
Selling, General & Admin Expense:
Research & Development Expense:
Total Operating Expenses:
Operating Income:
Income Taxes:
Net Income:
TMO Cash Flow
Enable JavaScript and reload
Operating Activities Net Income:
Depreciation, Depletion & Amortization:
Change in Accounts Receiveable:
Net Cash from Operations:
Repurchases/Buybacks Common Stock:
Issuance of Long-term Debt:
Cash Dividends Paid:
Net Cash from Financing Activities:
Property, Plant & Equipment Purchases:
Purchases of Businesses, Net of Cash:
Net Cash from Investing Activities:
Net Change in Cash & Equivalents:
TMO Balance Sheet
Enable JavaScript and reload
Cash and Cash Equivalents:
Short-Term Investments:
Accounts Receivable, Net:
Inventories:
Total Current Assets:
Property, Plant & Equipment, Net:
Total Assets:
Accounts Payable:
Current Portion of Long-Term Debt:
Total Short-Term Liabilities:
Long Term Debt, Non-Current Portion:
Total Long-Term Liabilities:
Total Liabilities:
COMPANY PROFILE
1 . General The interim consolidated financial statements presented herein have been prepared by Thermo Fisher Scientific Inc. (the company or Thermo Fisher), are unaudited and, in the opinion of management, reflect all adjustments of a normal recurring nature necessary for a fair statement of the financial position at April 3, 2010 , the results of operations for the three -month period s ended April 3, 2010 , and March 28, 2009 , and the cash flows for the three -month periods ended April 3, 2010 , and March 28, 2009 . Interim results are not necessarily indicative of results for a full year. The consolidated balance sheet presented as of December 31, 2009 , has been derived from the audited consolidated financial statements as of that date. The consolidated financial statements and notes are presented as permitted by Form 10-Q and do not contain all of the information that is included in the annual financial statements and notes of the company. The consolidated financial statements and notes included in this report should be read in conjunction with the financial statements and notes included in the company's Annual Report on Form 10 -K for the fiscal year ended December 31, 2009 , filed with the Securities and Exchange Commission (SEC ) .
Free historical financial statements for Thermo Fisher Scientific Inc. See how revenue, income, cash flow, and balance sheet financials have changed over 65 quarters since 2010. Compare with TMO stock chart to see long term trends.
Data imported from Thermo Fisher Scientific Inc SEC filings. Check original filings before making any investment decision.