Health Care › Biological Products (No Diagnostic Substances)

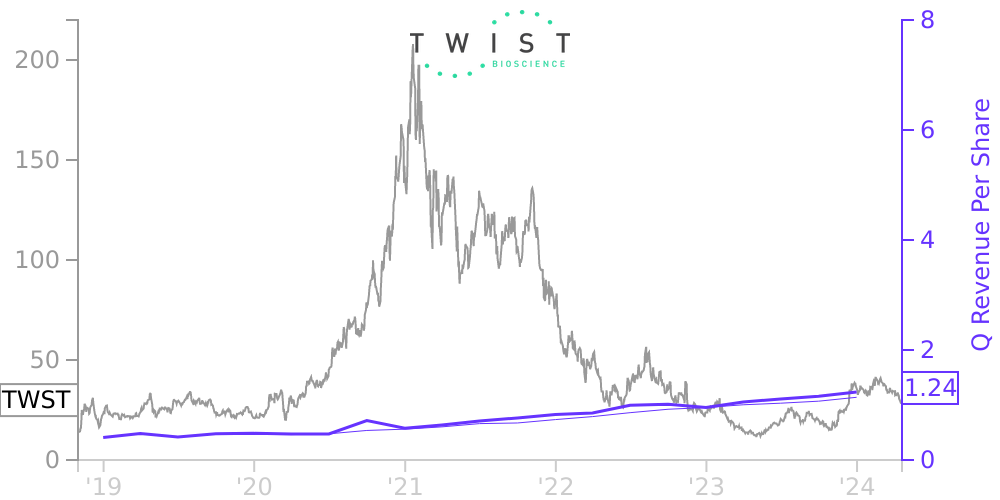
TWST Stock Price Correlated With Twist Bioscience Financials
External Links ⌄
Income Statement
Cash Flow
Balance Sheet
TWST Income Statement
Enable JavaScript and reload
Revenue, Net:
Cost of Goods & Services Sold:
Gross Profit:
Selling, General & Admin Expense:
Research & Development Expense:
Total Operating Expenses:
Operating Income:
Income Taxes:
Net Income:
TWST Cash Flow
Enable JavaScript and reload
Operating Activities Net Income:
Depreciation, Depletion & Amortization:
Change in Accounts Receiveable:
Net Cash from Operations:
Repurchases/Buybacks Common Stock:
Issuance of Long-term Debt:
Cash Dividends Paid:
Net Cash from Financing Activities:
Property, Plant & Equipment Purchases:
Purchases of Businesses, Net of Cash:
Net Cash from Investing Activities:
Net Change in Cash & Equivalents:
TWST Balance Sheet
Enable JavaScript and reload
Cash and Cash Equivalents:
Short-Term Investments:
Accounts Receivable, Net:
Inventories:
Total Current Assets:
Property, Plant & Equipment, Net:
Total Assets:
Accounts Payable:
Current Portion of Long-Term Debt:
Total Short-Term Liabilities:
Long Term Debt, Non-Current Portion:
Total Long-Term Liabilities:
Total Liabilities:
COMPANY PROFILE
1. The company Twist Bioscience Corporation (the Company) was incorporated in the state of Delaware on February 4, 2013. The Company is a synthetic biology company that has developed a disruptive DNA synthesis platform. DNA is used in many applications across different industries: industrial chemicals/materials, academic, healthcare and food/agriculture. The core of the Company’s platform is a proprietary technology that pioneers a new method of manufacturing synthetic DNA by “writing” DNA on a silicon chip. The Company has combined this technology with proprietary software, scalable commercial infrastructure and an e-commerce platform to create an integrated technology platform that enables the Company to achieve high levels of quality, precision, automation, and manufacturing throughput at a significantly lower cost than its competitors. The Company is leveraging its unique technology to manufacture a broad range of synthetic DNA-based products, including synthetic genes, tools for next generation sample preparation, and antibody libraries for drug discovery and development. The Company has a limited operating history and its prospects are subject to risks, expenses and uncertainties frequently encountered by companies in this industry. These risks include, but are not limited to, the uncertainty of availability of additional financing, market acceptance of its products, the ability to retain and attract new customers, and the uncertainty of achieving future profitability. The Company has generated net losses in all periods since inception. As of September 30, 2021, the Company had an accumulated deficit of $610.6 million and has not generated positive cash flows from operations since inception. Losses are expected to continue as the Company continues to invest in product development, manufacturing, and sales and marketing. Since its inception, the Company has received an aggregate of $1,063.9 million in net proceeds from the issuance of equity securities and an aggregate of $13.8 million from debt. Management believes that these proceeds combined with existing cash balances on hand will be sufficient to fund operations for at least one year from the issuance of these consolidated financial statements. However, if the Company needs to obtain additional financing to fund operations beyond this period, there can be no assurance that it will be successful in raising additional financing on terms which are acceptable to the Company.
Free historical financial statements for Twist Bioscience Corp. See how revenue, income, cash flow, and balance sheet financials have changed over 30 quarters since 2018. Compare with TWST stock chart to see long term trends.
Data imported from Twist Bioscience Corp SEC filings. Check original filings before making any investment decision.