Health Care › Plastics Foam Products

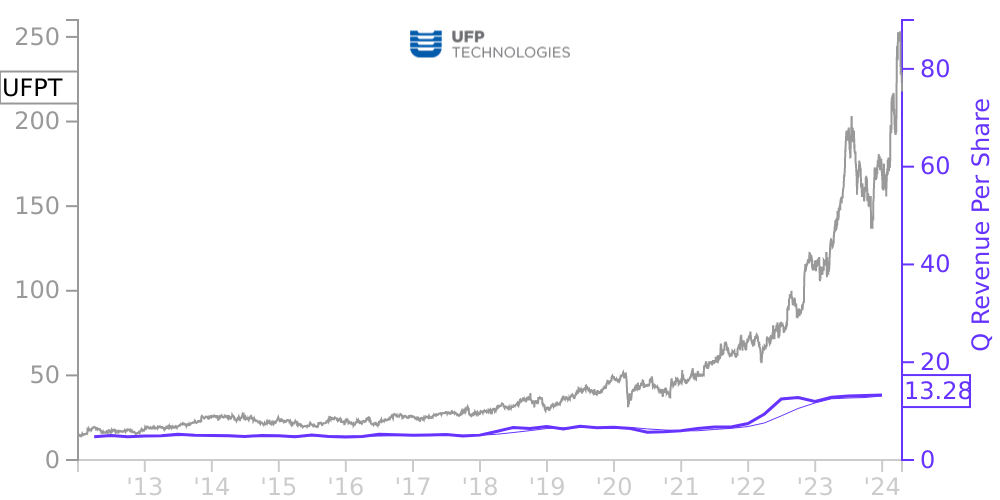
UFPT Stock Price Correlated With UFP Technologies Financials
External Links ⌄
Income Statement
Cash Flow
Balance Sheet
UFPT Income Statement
Enable JavaScript and reload
Revenue, Net:
Cost of Goods & Services Sold:
Gross Profit:
Selling, General & Admin Expense:
Research & Development Expense:
Total Operating Expenses:
Operating Income:
Income Taxes:
Net Income:
UFPT Cash Flow
Enable JavaScript and reload
Operating Activities Net Income:
Depreciation, Depletion & Amortization:
Change in Accounts Receiveable:
Net Cash from Operations:
Repurchases/Buybacks Common Stock:
Issuance of Long-term Debt:
Cash Dividends Paid:
Net Cash from Financing Activities:
Property, Plant & Equipment Purchases:
Purchases of Businesses, Net of Cash:
Net Cash from Investing Activities:
Net Change in Cash & Equivalents:
UFPT Balance Sheet
Enable JavaScript and reload
Cash and Cash Equivalents:
Short-Term Investments:
Accounts Receivable, Net:
Inventories:
Total Current Assets:
Property, Plant & Equipment, Net:
Total Assets:
Accounts Payable:
Current Portion of Long-Term Debt:
Total Short-Term Liabilities:
Long Term Debt, Non-Current Portion:
Total Long-Term Liabilities:
Total Liabilities:
COMPANY PROFILE
( 1) Basis of Presentation
The interim condensed consolidated financial statements of UFP Technologies, Inc. (the “Company”) presented herein, have been prepared pursuant to the rules of the Securities and Exchange Commission for quarterly reports on Form 10 -Q and do not include all the information and note disclosures required by accounting principles generally accepted in the United States of America. These statements should be read in conjunction with the consolidated financial statements and notes thereto for the year ended December 31, 2021, included in the Company's 2021 Annual Report on Form 10 -K, as filed with the Securities and Exchange Commission.
The condensed consolidated balance sheets as of March 31, 2022 and December 31, 2021, the condensed consolidated statements of income for the three months ended March 31, 2022 and 2021, the condensed consolidated statements of stockholders’ equity for the three months ended March 31, 2022 and 2021, and the condensed consolidated statements of cash flows for the three months ended March 31, 2022 and 2021 are unaudited but, in the opinion of management, include all adjustments (consisting of normal, recurring adjustments) necessary for a fair presentation of results for these interim periods. The condensed consolidated balance sheet as of December 31, 2021 has been derived from the Company’s annual financial statements that were audited by an independent registered public accounting firm but does not include all of the information and footnotes required for complete annual financial statements.
The preparation of financial statements in conformity with accounting principles generally accepted in the United States of America requires management to make estimates and assumptions that affect the reported amounts of assets and liabilities and disclosure of contingent assets and liabilities at the date of the financial statements and the reported amounts of revenues and expenses during the reporting period.
The results of operations for the three -month period ended March 31, 2022 are not necessarily indicative of the results to be expected for the entire fiscal year ending December 31, 2022.
New Accounting Policy
The Company translates all assets and liabilities of its foreign subsidiaries, where the U.S. dollar is not the functional currency, at the period-end exchange rate and translates income and expenses at the average exchange rates in effect during the period. The net effect of this translation is recorded in the consolidated financial statements as a component of AOCI. Translation adjustments are not adjusted for income taxes as they relate to permanent investments in the Company’s foreign subsidiaries.
Recent Accounting Pronouncements
There are no newly issued accounting pronouncements that the Company expects to have a material effect on the financial statements.
Free historical financial statements for UFP Technologies Inc.. See how revenue, income, cash flow, and balance sheet financials have changed over 57 quarters since 2012. Compare with UFPT stock chart to see long term trends.
Data imported from UFP Technologies Inc. SEC filings. Check original filings before making any investment decision.