Financials › Fire, Marine And Casualty Insurance

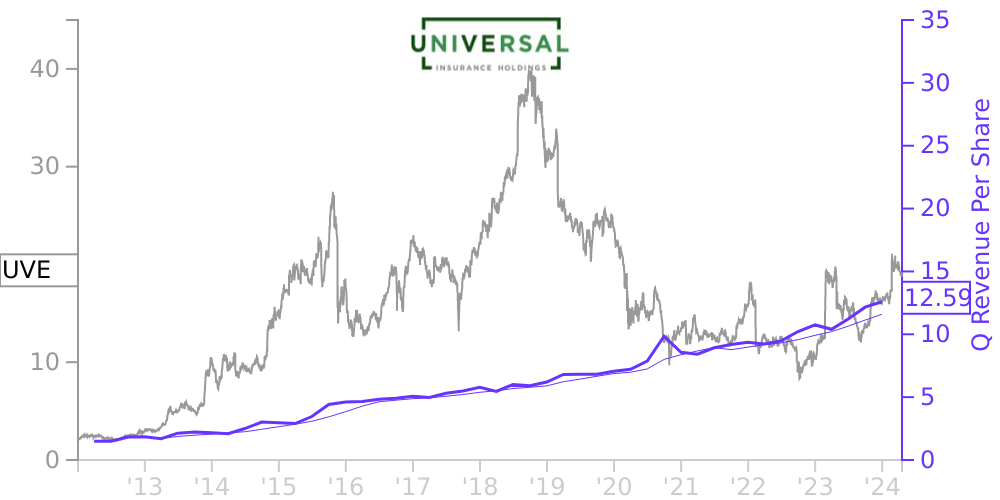
UVE Stock Price Correlated With Universal Insurance Holdings Financials
External Links ⌄
Income Statement
Cash Flow
Balance Sheet
UVE Income Statement
Enable JavaScript and reload
Revenue, Net:
Cost of Goods & Services Sold:
Gross Profit:
Selling, General & Admin Expense:
Research & Development Expense:
Total Operating Expenses:
Operating Income:
Income Taxes:
Net Income:
UVE Cash Flow
Enable JavaScript and reload
Operating Activities Net Income:
Depreciation, Depletion & Amortization:
Change in Accounts Receiveable:
Net Cash from Operations:
Repurchases/Buybacks Common Stock:
Issuance of Long-term Debt:
Cash Dividends Paid:
Net Cash from Financing Activities:
Property, Plant & Equipment Purchases:
Purchases of Businesses, Net of Cash:
Net Cash from Investing Activities:
Net Change in Cash & Equivalents:
UVE Balance Sheet
Enable JavaScript and reload
Cash and Cash Equivalents:
Short-Term Investments:
Accounts Receivable, Net:
Inventories:
Total Current Assets:
Property, Plant & Equipment, Net:
Total Assets:
Accounts Payable:
Current Portion of Long-Term Debt:
Total Short-Term Liabilities:
Long Term Debt, Non-Current Portion:
Total Long-Term Liabilities:
Total Liabilities:
COMPANY PROFILE
NATURE OF OPERATIONS AND BASIS OF PRESENTATION Nature of Operations, Basis of Presentation and Consolidation
Universal Insurance Holdings, Inc. (“UVE”, and together with its wholly-owned subsidiaries, “the Company”) is a Delaware corporation incorporated in 1990. The Company is a vertically integrated insurance holding company performing all aspects of insurance underwriting, distribution and claims. Through its wholly-owned insurance company subsidiaries, Universal Property & Casualty Insurance Company (“UPCIC”) and American Platinum Property and Casualty Insurance Company (“APPCIC”, and together with UPCIC, the “Insurance Entities”), the Company is principally engaged in the property and casualty insurance business offered primarily through its network of independent agents. Risk from catastrophic losses is managed through the use of reinsurance agreements. The Company’s primary product is residential homeowners’ insurance offered in 19 states as of December 31, 2021, including Florida, which comprises the majority of the Company’s policies in force. See “—Note 5 (Insurance Operations) ” for more information regarding the Company’s insurance operations.
The Company generates revenues primarily from the collection of premiums and investment returns on funds invested on cash flows in excess of those retained and used for claims-paying obligations and insurance operations. Other significant sources of revenue include brokerage commissions collected from reinsurers on certain reinsurance programs placed on behalf of the Insurance Entities, policy fees collected from policyholders by the Company’s wholly-owned managing general agent (“MGA”) subsidiary and payment plan fees charged to policyholders who choose to pay their premiums in installments. The Company’s wholly-owned adjusting company receives claims-handling fees from the Insurance Entities. The Insurance Entities are reimbursed for these fees on claims that are subject to recovery under the Insurance Entities’ respective reinsurance programs. These fees, after expenses, are recorded in the Consolidated Financial Statements as an adjustment to losses and loss adjustment expense (“LAE”).
The Consolidated Financial Statements have been prepared in conformity with generally accepted accounting principles in the United States of America (“U.S. GAAP”). The Consolidated Financial Statements include the accounts of UVE and its wholly-owned subsidiaries, as well as variable interest entities (“VIE”) in which the Company is determined to be the primary beneficiary. All material intercompany balances and transactions have been eliminated in consolidation.
To conform to the current period presentation, certain amounts in the prior periods’ consolidated financial statements and notes have been reclassified. Such reclassifications were of an immaterial amount and had no effect on net income or stockholders’ equity.
Use of Estimates
The preparation of financial statements in conformity with U.S. GAAP requires management to make estimates and assumptions that affect the reported amounts of assets and liabilities and disclosure of contingent assets and liabilities as of the date of the consolidated financial statements and the reported amounts of revenues and expenses during the reporting periods. The Company’s primary use of estimates is in the recognition of liabilities for unpaid losses, loss adjustment expenses, subrogation recoveries, and reinsurance recoveries. Actual results could differ from those estimates.
Free historical financial statements for Universal Insurance Holdings Inc. See how revenue, income, cash flow, and balance sheet financials have changed over 57 quarters since 2012. Compare with UVE stock chart to see long term trends.
Data imported from Universal Insurance Holdings Inc SEC filings. Check original filings before making any investment decision.