Consumer Staples › Wholesale-Farm Product Raw Materials

UVV Stock Price Correlated With Universal Financials
External Links ⌄
Income Statement
Cash Flow
Balance Sheet
UVV Income Statement
Enable JavaScript and reload
Revenue, Net:
Cost of Goods & Services Sold:
Gross Profit:
Selling, General & Admin Expense:
Research & Development Expense:
Total Operating Expenses:
Operating Income:
Income Taxes:
Net Income:
UVV Cash Flow
Enable JavaScript and reload
Operating Activities Net Income:
Depreciation, Depletion & Amortization:
Change in Accounts Receiveable:
Net Cash from Operations:
Repurchases/Buybacks Common Stock:
Issuance of Long-term Debt:
Cash Dividends Paid:
Net Cash from Financing Activities:
Property, Plant & Equipment Purchases:
Purchases of Businesses, Net of Cash:
Net Cash from Investing Activities:
Net Change in Cash & Equivalents:
UVV Balance Sheet
Enable JavaScript and reload
Cash and Cash Equivalents:
Short-Term Investments:
Accounts Receivable, Net:
Inventories:
Total Current Assets:
Property, Plant & Equipment, Net:
Total Assets:
Accounts Payable:
Current Portion of Long-Term Debt:
Total Short-Term Liabilities:
Long Term Debt, Non-Current Portion:
Total Long-Term Liabilities:
Total Liabilities:
COMPANY PROFILE
BASIS OF PRESENTATION Universal Corporation, which together with its subsidiaries is referred to herein as “Universal” or the “Company,” is a global business-to-business agri-products supplier to consumer product manufacturers. The Company is the leading global leaf tobacco supplier and provides high-quality plant-based ingredients to food and beverage end markets. Because of the seasonal nature of the Company’s business, the results of operations for any fiscal quarter will not necessarily be indicative of results to be expected for other quarters or a full fiscal year. All adjustments necessary to state fairly the results for the period have been included and were of a normal recurring nature. This Form 10-Q should be read in conjunction with the financial statements and notes thereto included in the Company’s Annual Report on Form 10-K for the fiscal year ended March 31, 2022. The extent to which the ongoing COVID-19 pandemic will impact the Company's financial condition, results of operations and demand for its products and services will depend on future developments, which are highly uncertain and cannot be predicted. Such developments may include the ongoing geographic spread and mutations of COVID-19, the severity of the pandemic, the duration of the COVID-19 outbreak and the type and duration of actions that may be taken by various governmental authorities in response to the COVID-19 pandemic and the impact on the U.S. and the global economies, markets and supply chains. At June 30, 2022, it is not possible to predict the overall impact of the ongoing COVID-19 pandemic on the Company's business, financial condition, results of operations and demand for its products and services.
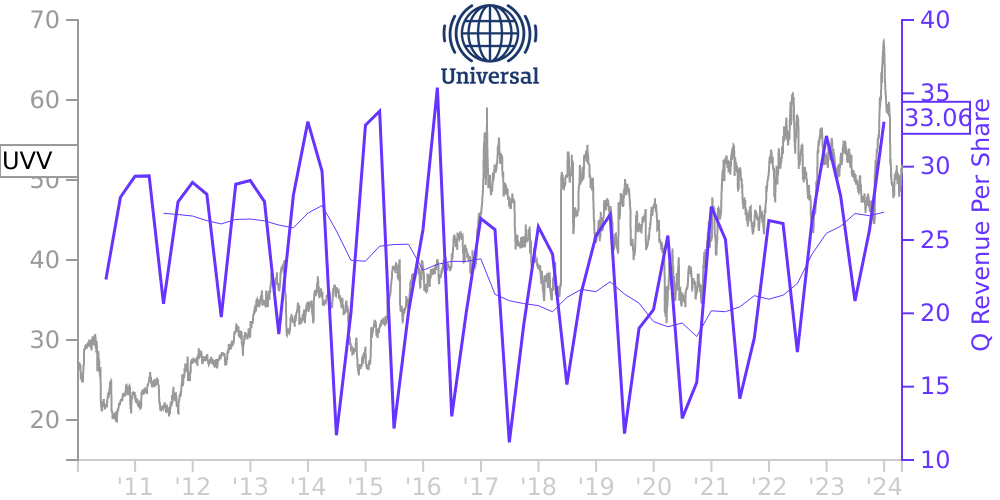
Free historical financial statements for Universal Corp. See how revenue, income, cash flow, and balance sheet financials have changed over 64 quarters since 2010. Compare with UVV stock chart to see long term trends.
Data imported from Universal Corp SEC filings. Check original filings before making any investment decision.