Free Alerts   Login
Financials › Services-Business Services, Nec

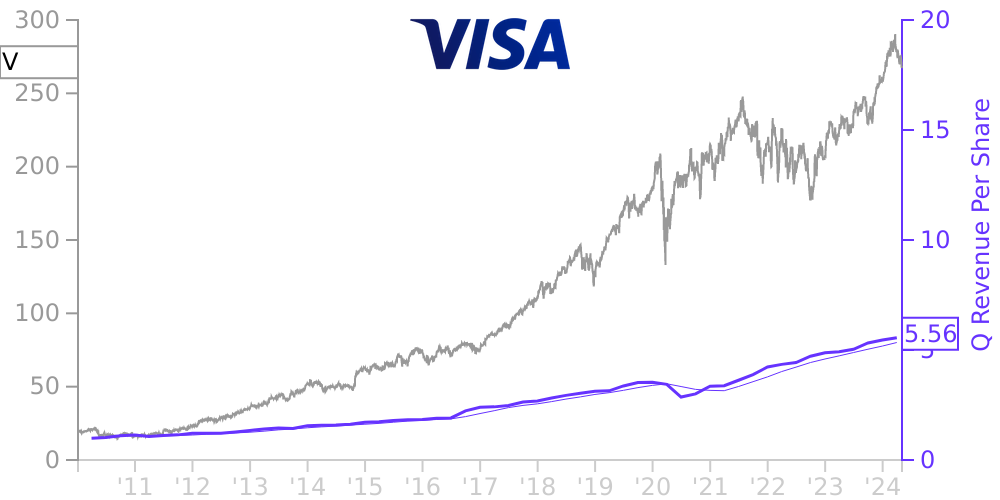
V Stock Price Correlated With Visa Financials

V Stock Price vs. Quarterly
V
Income Statement
Cash Flow
Balance Sheet

V Income Statement

Enable JavaScript and reload
Revenue, Net:
Revenue Per Share:
Cost of Goods & Services Sold:
Gross Profit:
Selling, General & Admin Expense:
Research & Development Expense:
Total Operating Expenses:
Operating Income:
Income Taxes:
Net Income:
Earnings Per Share, Diluted:
Earnings Per Share, Basic:
Shares Outstanding, Basic Avg:
Shares Outstanding, Diluted Avg:
Common Stock Shares Outstanding:

V Cash Flow

Enable JavaScript and reload
Operating Activities Net Income:
Depreciation, Depletion & Amortization:
Change in Accounts Receiveable:
Net Cash from Operations:
Net Cash from Operations Per Share:
Repurchases/Buybacks Common Stock:
Issuance of Long-term Debt:
Cash Dividends Paid:
Net Cash from Financing Activities:
Property, Plant & Equipment Purchases:
Purchases of Businesses, Net of Cash:
Net Cash from Investing Activities:
Net Change in Cash & Equivalents:

V Balance Sheet

Enable JavaScript and reload
Cash and Cash Equivalents:
Short-Term Investments:
Accounts Receivable, Net:
Inventories:
Total Current Assets:
Property, Plant & Equipment, Net:
Total Assets:
Accounts Payable:
Current Portion of Long-Term Debt:
Total Short-Term Liabilities:
Long Term Debt, Non-Current Portion:
Total Long-Term Liabilities:
Total Liabilities:

Major Holders (from 13F filings)

Investment Type
Change
Value (x$1000)
increase or decrease
Vanguard Group
141,052,668 sh
-470,746 sh
0%
$32,443,524
-$1,165,455
Blackrock.
124,901,366 sh
-2,010,839 sh
-2%
$28,728,563
-$1,410,548
State Street
71,470,474 sh
-2,662,529 sh
-4%
$16,438,924
-$1,166,182
FMR
50,357,747 sh
2,257,605 sh
5%
$11,582,785
$159,963
Morgan Stanley
49,810,255 sh
-174,349 sh
0%
$11,456,858
-$413,485
Price T Rowe Associates /Md/
46,169,322 sh
-857,946 sh
-2%
$10,619
-$549
Geode Capital Management
33,786,130 sh
546,815 sh
2%
$7,755,926
-$118,419
Bank Of America /De/
24,539,606 sh
-11,366 sh
0%
$5,644,356
-$186,009
Alliancebernstein
24,189,953 sh
-1,377,421 sh
-5%
$5,563,931
-$507,809
Capital International Investors
22,346,823 sh
1,892,544 sh
9%
$5,140,626
$284,327
Massachusetts Financial Services /Ma/
21,293,132 sh
-801,446 sh
-4%
$4,897,633
-$349,388
Goldman Sachs Group
20,224,863 sh
19,727,363 sh
3965%
$4,651,922
$4,533,776
Wellington Management Group Llp
19,242,995 sh
-883,213 sh
-4%
$4,426,082
-$353,491
Royal Bank Of Canada
18,738,606 sh
-140,741 sh
-1%
$4,310,067
-$173,399
Northernrp
17,073,700 sh
763,505 sh
5%
$3,927,121
$53,776
Capital World Investors
16,572,550 sh
559,967 sh
3%
$3,811,852
$9,184
Ameriprise Financial
14,229,004 sh
374,489 sh
3%
$3,272,846
-$17,953
Bank Of New York Mellon
12,383,002 sh
-287,898 sh
-2%
$2,848,213
-$160,869
Jennison Associates
11,738,990 sh
-322,663 sh
-3%
$2,700,085
-$164,316
Nuveen Asset Management
11,466,797 sh
-678,221 sh
-6%
$2,637,478
-$246,721

Free historical financial statements for Visa Inc. See how revenue, income, cash flow, and balance sheet financials have changed over 56 quarters since 2009. Compare with V stock chart to see long term trends.

Data imported from Visa Inc SEC filings. Check original filings before making any investment decision.