Consumer Staples › Fabricated Rubber Products, Nec

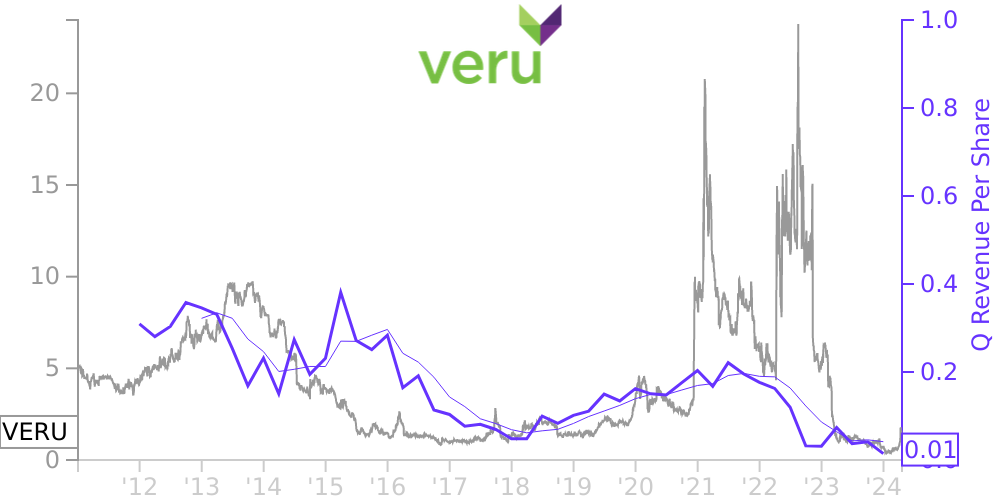
VERU Stock Price Correlated With Veru Financials
External Links ⌄
Income Statement
Cash Flow
Balance Sheet
VERU Income Statement
Enable JavaScript and reload
Revenue, Net:
Cost of Goods & Services Sold:
Gross Profit:
Selling, General & Admin Expense:
Research & Development Expense:
Total Operating Expenses:
Operating Income:
Income Taxes:
Net Income:
VERU Cash Flow
Enable JavaScript and reload
Operating Activities Net Income:
Depreciation, Depletion & Amortization:
Change in Accounts Receiveable:
Net Cash from Operations:
Repurchases/Buybacks Common Stock:
Issuance of Long-term Debt:
Cash Dividends Paid:
Net Cash from Financing Activities:
Property, Plant & Equipment Purchases:
Purchases of Businesses, Net of Cash:
Net Cash from Investing Activities:
Net Change in Cash & Equivalents:
VERU Balance Sheet
Enable JavaScript and reload
Cash and Cash Equivalents:
Short-Term Investments:
Accounts Receivable, Net:
Inventories:
Total Current Assets:
Property, Plant & Equipment, Net:
Total Assets:
Accounts Payable:
Current Portion of Long-Term Debt:
Total Short-Term Liabilities:
Long Term Debt, Non-Current Portion:
Total Long-Term Liabilities:
Total Liabilities:
COMPANY PROFILE
Principles of consolidation and nature of operations: Veru Inc. is referred to in these notes collectively with its subsidiaries as “we,” “our,” “us,” “Veru” or the “Company.” The consolidated financial statements include the accounts of Veru and its wholly owned subsidiaries, Aspen Park Pharmaceuticals, Inc. (APP) and The Female Health Company Limited, The Female Health Company Limited’s wholly owned subsidiary, The Female Health Company (UK) plc (The Female Health Company Limited and The Female Health Company (UK) plc, collectively, the “U.K. subsidiary”), and The Female Health Company (UK) plc’s wholly owned subsidiary, The Female Health Company (M) SDN.BHD (the “Malaysia subsidiary”). All significant intercompany transactions and accounts have been eliminated in consolidation. The Company is an oncology biopharmaceutical company with a focus on developing novel medicines for the management of breast and prostate cancers. The Company has two operating segments: the Research and Development segment and the Sexual Health Business segment. The Company has multiple drug products under clinical development. Activities related to these potential drug products are included in the Research and Development segment. The Company’s Sexual Health Business segment includes its commercial product, FC2, an FDA-approved product for the dual protection against unintended pregnancy and sexually transmitted infections. During fiscal 2020, the Sexual Health Business segment also included PREBOOST® 4% benzocaine medicated individual wipe for the treatment of premature ejaculation. The PREBOOST® business was sold on December 8, 2020. See Note 2 for additional information. Most of the Company’s net revenues during fiscal 2021 and 2020 were derived from sales of FC2. FC2 has been distributed in either or both commercial (private sector) and public health sector markets in 150 countries. It is marketed to consumers in 22 countries through distributors, public health programs, and/or retailers and in the U.S. by prescription.
Free historical financial statements for Veru Inc. See how revenue, income, cash flow, and balance sheet financials have changed over 55 quarters since 2011. Compare with VERU stock chart to see long term trends.
Data imported from Veru Inc SEC filings. Check original filings before making any investment decision.