Health Care › Biological Products (no Diagnostic Substances)

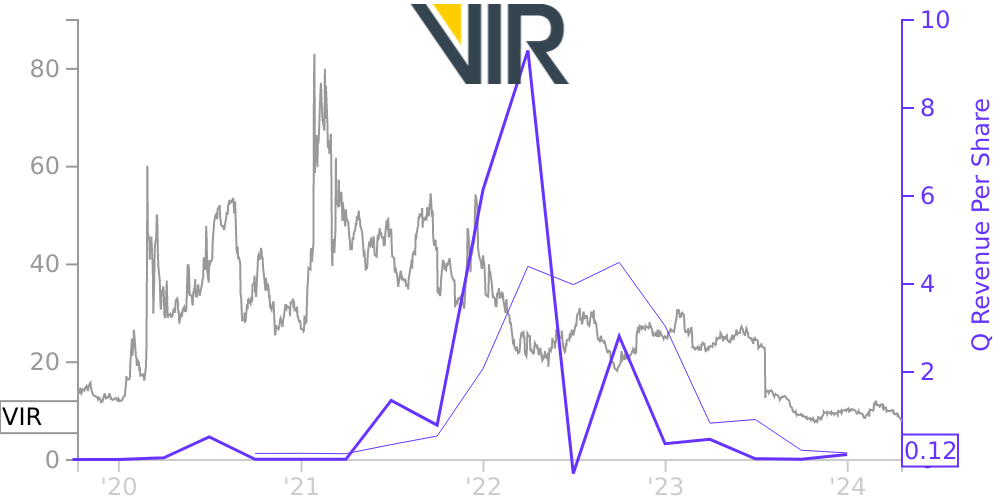
VIR Stock Price Correlated With Vir Biotechnology Financials
External Links ⌄
Income Statement
Cash Flow
Balance Sheet
VIR Income Statement
Enable JavaScript and reload
Revenue, Net:
Cost of Goods & Services Sold:
Gross Profit:
Selling, General & Admin Expense:
Research & Development Expense:
Total Operating Expenses:
Operating Income:
Income Taxes:
Net Income:
VIR Cash Flow
Enable JavaScript and reload
Operating Activities Net Income:
Depreciation, Depletion & Amortization:
Change in Accounts Receiveable:
Net Cash from Operations:
Repurchases/Buybacks Common Stock:
Issuance of Long-term Debt:
Cash Dividends Paid:
Net Cash from Financing Activities:
Property, Plant & Equipment Purchases:
Purchases of Businesses, Net of Cash:
Net Cash from Investing Activities:
Net Change in Cash & Equivalents:
VIR Balance Sheet
Enable JavaScript and reload
Cash and Cash Equivalents:
Short-Term Investments:
Accounts Receivable, Net:
Inventories:
Total Current Assets:
Property, Plant & Equipment, Net:
Total Assets:
Accounts Payable:
Current Portion of Long-Term Debt:
Total Short-Term Liabilities:
Long Term Debt, Non-Current Portion:
Total Long-Term Liabilities:
Total Liabilities:
COMPANY PROFILE
1. Organization Vir Biotechnology, Inc. (“Vir” or the “Company”) is a commercial-stage immunology company focused on combining immunologic insights with cutting-edge technologies to treat and prevent serious infectious diseases. Its current pipeline consists of sotrovimab (previously VIR-7831; and where marketing authorization has been granted, marketed under the brand name Xevudy®) and other product candidates targeting coronavirus disease 2019 (“COVID-19”), hepatitis B virus (“HBV”), influenza A virus, and human immunodeficiency virus (“HIV”). Vir has assembled four technology platforms that are designed to stimulate and enhance the immune system by exploiting critical observations of natural immune processes. Sales Agreement In November 2020, the Company entered into a sales agreement (the “Sales Agreement”) with Cowen and Company, LLC (“Cowen”), under which the Company may from time to time offer and sell shares of its common stock for an aggregate offering price of up to $ 300.0 million, through or to Cowen, acting as sales agent or principal. The shares will be offered and sold under the Company’s shelf registration statement on Form S-3 and a related prospectus filed with the Securities and Exchange Commission (the “SEC”) on November 10, 2020. The Company will pay Cowen a commission of up to 3.0 % of the aggregate gross proceeds from each sale of shares, reimburse legal fees and disbursements and provide Cowen with customary indemnification and contribution rights. As of June 30, 2022 , no shares have been issued under the Sales Agreement. Need for Additional Capital Although the Company recorded net income for the year ended December 31, 2021 and the six months ended June 30, 2022, it recorded a net loss for the three months ended June 30, 2022, and has otherwise incurred net losses since inception. The Company expects its earnings to be volatile and may continue to incur net losses over the next several years and may need to raise additional capital to fully implement its business plan. As of June 30, 2022, the Company had retained earnings of $ 303.5 million . The Company had, excluding restricted cash, $ 2.3 billion of cash, cash equivalents, and investments as of June 30, 2022. Based on the Company’s current operating plan, management believes that the $ 2.3 billion as of June 30, 2022 will be sufficient to fund its operations through at least the next 12 months from the issuance date of these unaudited condensed consolidated financial statements.
Free historical financial statements for Vir Biotechnology, Inc.. See how revenue, income, cash flow, and balance sheet financials have changed over 27 quarters since 2019. Compare with VIR stock chart to see long term trends.
Data imported from Vir Biotechnology, Inc. SEC filings. Check original filings before making any investment decision.