Communication › Telephone Communications (No Radio Telephone)

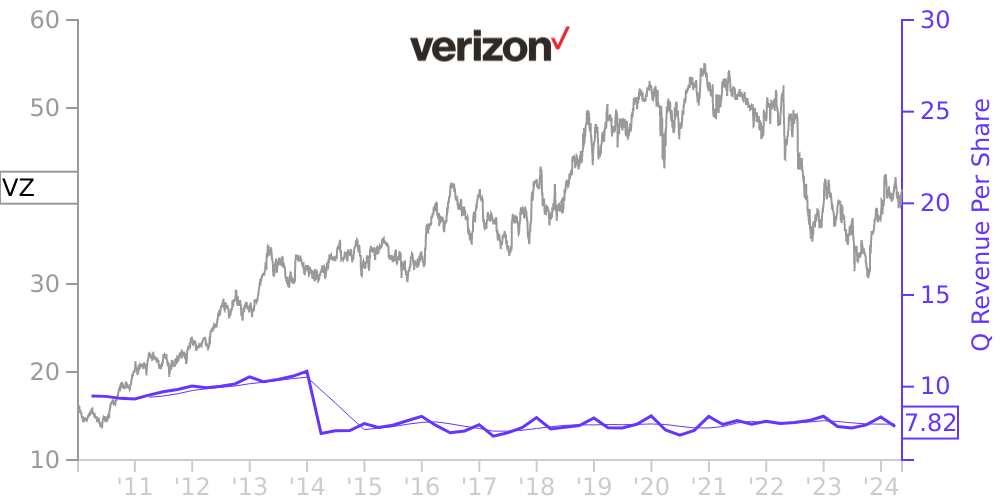
VZ Stock Price Correlated With Verizon Communications Financials
External Links ⌄
Income Statement
Cash Flow
Balance Sheet
VZ Income Statement
Enable JavaScript and reload
Revenue, Net:
Cost of Goods & Services Sold:
Gross Profit:
Selling, General & Admin Expense:
Research & Development Expense:
Total Operating Expenses:
Operating Income:
Income Taxes:
Net Income:
VZ Cash Flow
Enable JavaScript and reload
Operating Activities Net Income:
Depreciation, Depletion & Amortization:
Change in Accounts Receiveable:
Net Cash from Operations:
Repurchases/Buybacks Common Stock:
Issuance of Long-term Debt:
Cash Dividends Paid:
Net Cash from Financing Activities:
Property, Plant & Equipment Purchases:
Purchases of Businesses, Net of Cash:
Net Cash from Investing Activities:
Net Change in Cash & Equivalents:
VZ Balance Sheet
Enable JavaScript and reload
Cash and Cash Equivalents:
Short-Term Investments:
Accounts Receivable, Net:
Inventories:
Total Current Assets:
Property, Plant & Equipment, Net:
Total Assets:
Accounts Payable:
Current Portion of Long-Term Debt:
Total Short-Term Liabilities:
Long Term Debt, Non-Current Portion:
Total Long-Term Liabilities:
Total Liabilities:
COMPANY PROFILE
Note 1. Basis of Presentation
The accompanying unaudited condensed consolidated financial statements have been prepared in accordance with generally accepted accounting principles (GAAP) in the United States (U.S.) and based upon Securities and Exchange Commission rules that permit reduced disclosure for interim periods. For a more complete discussion of significant accounting policies and certain other information, you should refer to the financial statements included in Verizon Communications Inc.'s (Verizon or the Company) Annual Report on Form 10-K for the year ended December 31, 2021. These financial statements reflect all adjustments that are necessary for a fair presentation of results of operations and financial condition for the interim periods shown, including normal recurring accruals and other items. The results for the interim periods are not necessarily indicative of results for the full year.
Earnings Per Common Share
There were a total of approximately 1.4 million and 1.5 million outstanding dilutive securities, primarily consisting of restricted stock units, included in the computation of diluted earnings per common share for the three and six months ended June 30, 2022, respectively. There were a total of approximately 1.9 million and 1.8 million outstanding dilutive securities, primarily consisting of restricted stock units, included in the computation of diluted earnings per common share for the three and six months ended June 30, 2021, respectively.
Cash, Cash Equivalents and Restricted Cash
We consider all highly liquid investments with an original maturity of 90 days or less when purchased to be cash equivalents. Cash equivalents are stated at cost, which approximates quoted market value and includes amounts held in money market funds.
Cash collections on the device payment plan agreement receivables collateralizing our asset-backed debt securities are required at certain specified times to be placed into segregated accounts. Deposits to the segregated accounts are considered restricted cash and are included in Prepaid expenses and other and Other assets in our condensed consolidated balance sheets.
Cash, cash equivalents and restricted cash are included in the following line items in the condensed consolidated balance sheets:
At June 30, At December 31, Increase / (Decrease) (dollars in millions)
2022 2021 Cash and cash equivalents $ 1,857 $ 2,921 $ (1,064) Restricted cash: Prepaid expenses and other
1,322 1,094 228 Other assets
154 146 8 Cash, cash equivalents and restricted cash $ 3,333 $ 4,161 $ (828)
Free historical financial statements for Verizon Communications Inc. See how revenue, income, cash flow, and balance sheet financials have changed over 65 quarters since 2010. Compare with VZ stock chart to see long term trends.
Data imported from Verizon Communications Inc SEC filings. Check original filings before making any investment decision.