Consumer Staples › Retail-Drug Stores And Proprietary Stores

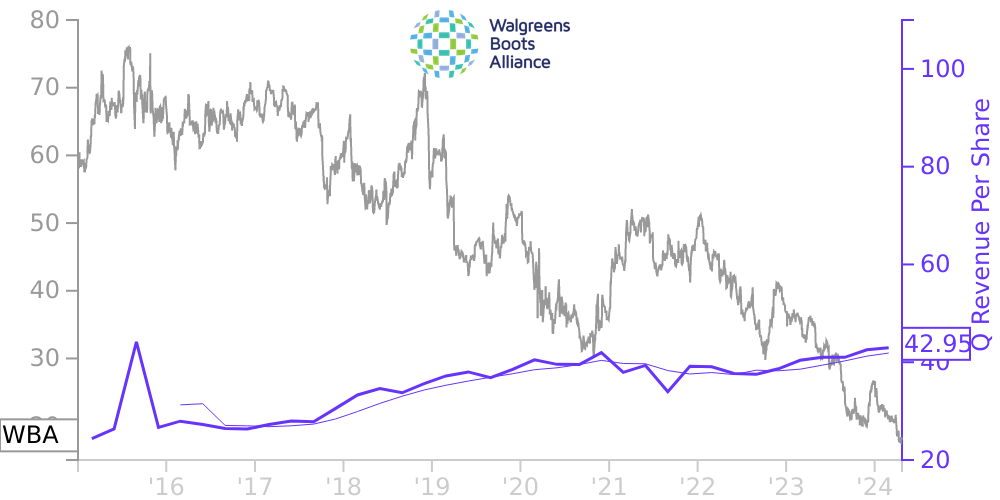
WBA Stock Price Correlated With Walgreens Boots Alliance Financials
External Links ⌄
Income Statement
Cash Flow
Balance Sheet
WBA Income Statement
Enable JavaScript and reload
Revenue, Net:
Cost of Goods & Services Sold:
Gross Profit:
Selling, General & Admin Expense:
Research & Development Expense:
Total Operating Expenses:
Operating Income:
Income Taxes:
Net Income:
WBA Cash Flow
Enable JavaScript and reload
Operating Activities Net Income:
Depreciation, Depletion & Amortization:
Change in Accounts Receiveable:
Net Cash from Operations:
Repurchases/Buybacks Common Stock:
Issuance of Long-term Debt:
Cash Dividends Paid:
Net Cash from Financing Activities:
Property, Plant & Equipment Purchases:
Purchases of Businesses, Net of Cash:
Net Cash from Investing Activities:
Net Change in Cash & Equivalents:
WBA Balance Sheet
Enable JavaScript and reload
Cash and Cash Equivalents:
Short-Term Investments:
Accounts Receivable, Net:
Inventories:
Total Current Assets:
Property, Plant & Equipment, Net:
Total Assets:
Accounts Payable:
Current Portion of Long-Term Debt:
Total Short-Term Liabilities:
Long Term Debt, Non-Current Portion:
Total Long-Term Liabilities:
Total Liabilities:
COMPANY PROFILE
Note 1. Organization
Walgreens Boots Alliance, Inc. (“Walgreens Boots Alliance”) and subsidiaries are a global pharmacy-led wellbeing enterprise. Its operations are conducted through three reportable segments (Retail Pharmacy USA, Retail Pharmacy International and Pharmaceutical Wholesale). See Note 19, Segment Reporting for additional discussion.
On December 31, 2014, Walgreens Boots Alliance became the successor of Walgreen Co. (“Walgreens”) pursuant to a merger designed to effect a reorganization of Walgreens into a holding company structure (the “Reorganization”). Pursuant to the Reorganization, Walgreens became a wholly-owned subsidiary of Walgreens Boots Alliance, a newly-formed Delaware corporation, and each issued and outstanding share of Walgreens common stock, par value $0.078125, converted on a one-to-one basis into Walgreens Boots Alliance common stock, par value $0.01.
On December 31, 2014, following the completion of the Reorganization, Walgreens Boots Alliance completed the acquisition of the remaining 55% of Alliance Boots GmbH (“Alliance Boots”) that Walgreens did not previously own (the “Second Step Transaction”) in exchange for £3.133 billion in cash and approximately 144.3 million shares of Walgreens Boots Alliance common stock pursuant to the Purchase and Option Agreement dated June 18, 2012, as amended (the “Purchase and Option Agreement”). Alliance Boots became a consolidated subsidiary and ceased being accounted for under the equity method immediately upon completion of the Second Step Transaction. For financial reporting and accounting purposes, Walgreens Boots Alliance was the acquirer of Alliance Boots. The consolidated financial statements (and other data) reflect the results of operations and financial position of Walgreens and its subsidiaries for periods prior to December 31, 2014 and of Walgreens Boots Alliance and its subsidiaries for periods from and after the effective time of the Reorganization on December 31, 2014.
References to the “Company” refer to Walgreens Boots Alliance and its subsidiaries from and after the effective time of the Reorganization on December 31, 2014 and, prior to that time, to the predecessor registrant Walgreens and its subsidiaries, except as otherwise indicated or the context otherwise requires.
Free historical financial statements for Walgreens Boots Alliance Inc.. See how revenue, income, cash flow, and balance sheet financials have changed over 42 quarters since 2015. Compare with WBA stock chart to see long term trends.
Data imported from Walgreens Boots Alliance Inc. SEC filings. Check original filings before making any investment decision.