Consumer Staples › Retail-Variety Stores

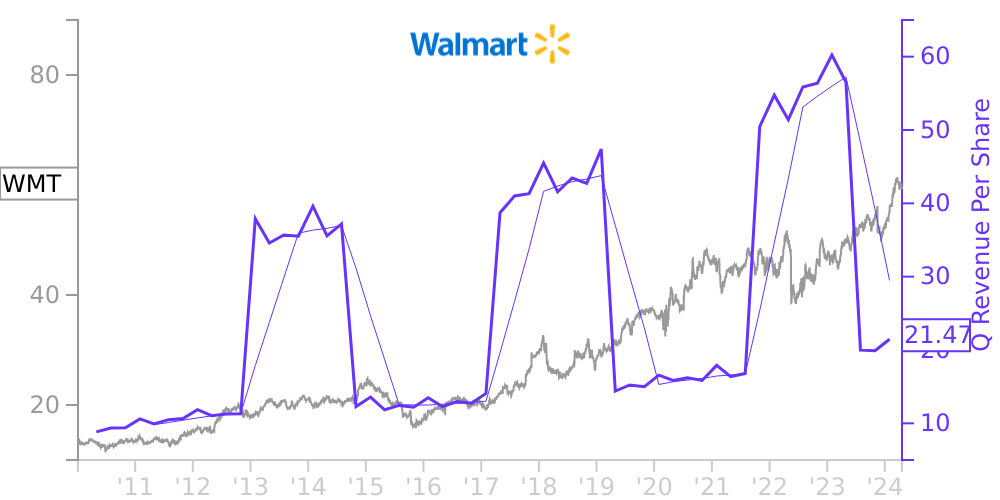
WMT Stock Price Correlated With Walmart Financials
External Links ⌄
Income Statement
Cash Flow
Balance Sheet
WMT Income Statement
Enable JavaScript and reload
Revenue, Net:
Cost of Goods & Services Sold:
Gross Profit:
Selling, General & Admin Expense:
Research & Development Expense:
Total Operating Expenses:
Operating Income:
Income Taxes:
Net Income:
WMT Cash Flow
Enable JavaScript and reload
Operating Activities Net Income:
Depreciation, Depletion & Amortization:
Change in Accounts Receiveable:
Net Cash from Operations:
Repurchases/Buybacks Common Stock:
Issuance of Long-term Debt:
Cash Dividends Paid:
Net Cash from Financing Activities:
Property, Plant & Equipment Purchases:
Purchases of Businesses, Net of Cash:
Net Cash from Investing Activities:
Net Change in Cash & Equivalents:
WMT Balance Sheet
Enable JavaScript and reload
Cash and Cash Equivalents:
Short-Term Investments:
Accounts Receivable, Net:
Inventories:
Total Current Assets:
Property, Plant & Equipment, Net:
Total Assets:
Accounts Payable:
Current Portion of Long-Term Debt:
Total Short-Term Liabilities:
Long Term Debt, Non-Current Portion:
Total Long-Term Liabilities:
Total Liabilities:
COMPANY PROFILE
Summary of Significant Accounting Policies General
Walmart Inc. ("Walmart" or the "Company") helps people around the world save money and live better – anytime and anywhere – by providing the opportunity to shop in both retail stores and through eCommerce. Through innovation, the Company is striving to continuously improve a customer-centric experience that seamlessly integrates eCommerce and retail stores in an omni-channel offering that saves time for its customers.
The Company's operations comprise three reportable segments: Walmart U.S., Walmart International and Sam's Club.
Principles of Consolidation
The Consolidated Financial Statements include the accounts of Walmart and its subsidiaries as of and for the fiscal years ended January 31, 2022 ("fiscal 2022"), January 31, 2021 ("fiscal 2021") and January 31, 2020 ("fiscal 2020"). Intercompany accounts and transactions have been eliminated in consolidation. Certain previously reported amounts have been reclassified to conform to the current year presentation. The Company consolidates variable interest entities where it has been determined that the Company is the primary beneficiary of those entities' operations. Investments for which the Company exercises significant influence but does not have control are accounted for under the equity method. These variable interest entities and equity method investments are immaterial to the Company's Consolidated Financial Statements.
The Company's Consolidated Financial Statements are based on a fiscal year ending on January 31 for the United States ("U.S.") and Canadian operations. The Company consolidates all other operations generally using a one-month lag and based on a calendar year. There were no significant intervening events during the month of January 2022 related to the operations consolidated using a lag that materially affected the Consolidated Financial Statements.
Use of Estimates
The Consolidated Financial Statements have been prepared in conformity with U.S. generally accepted accounting principles. Those principles require management to make estimates and assumptions that affect the reported amounts of assets and liabilities. Management's estimates and assumptions also affect the disclosure of contingent assets and liabilities at the date of the financial statements and the reported amounts of revenues and expenses during the reporting period. Actual results may differ from those estimates.
Cash and Cash Equivalents
The Company considers investments with a maturity when purchased of three months or less to be cash equivalents. All credit card, debit card and electronic transfer transactions that process in less than seven days are classified as cash and cash equivalents. The amounts due from banks for these transactions classified as cash and cash equivalents totaled $1.7 billion and $4.1 billion as of January 31, 2022 and 2021, respectively.
The Company's cash balances are held in various locations around the world. Of the Company's $14.8 billion and $17.7 billion in cash and cash equivalents as of January 31, 2022 and January 31, 2021, approximately 50% and 40% were held outside of the U.S., respectively. Cash and cash equivalents held outside of the U.S. are generally utilized to support liquidity needs in the Company's non-U.S. operations.
The Company uses intercompany financing arrangements in an effort to ensure cash can be made available in the country in which it is needed with the minimum cost possible.
As of January 31, 2022 and 2021, cash and cash equivalents of approximately $4.3 billion and $2.8 billion, respectively, may not be freely transferable to the U.S. due to local laws or other restrictions. Of the $4.3 billion as of January 31, 2022, approximately $2.2 billion can only be accessed through dividends or intercompany financing arrangements subject to approval of Flipkart Private Limited ("Flipkart") minority shareholders.
Receivables
Receivables are stated at their car
Free historical financial statements for Walmart Inc. See how revenue, income, cash flow, and balance sheet financials have changed over 65 quarters since 2010. Compare with WMT stock chart to see long term trends.
Data imported from Walmart Inc SEC filings. Check original filings before making any investment decision.