Consumer Discretionary › Retail-Auto And Home Supply Stores

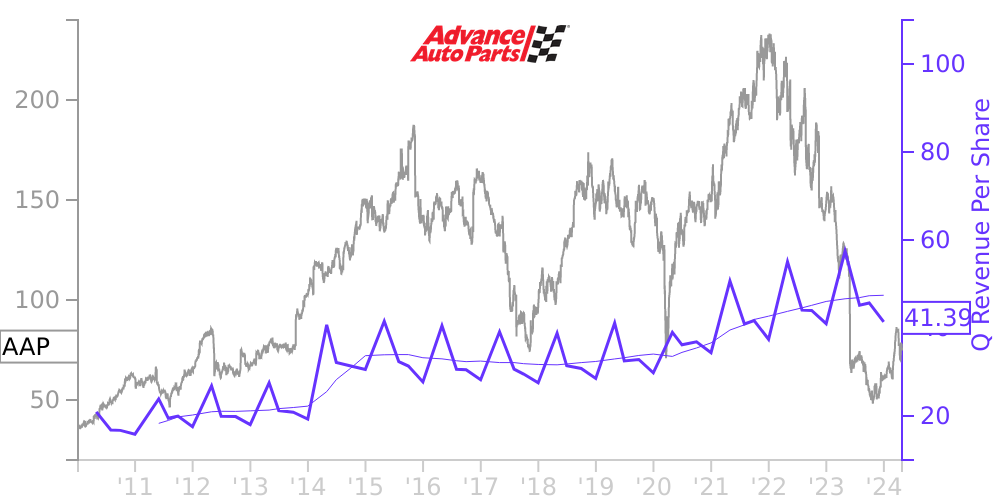
AAP Stock Price Correlated With Advance Auto Parts Financials
External Links ⌄
Income Statement
Cash Flow
Balance Sheet
AAP Income Statement
Enable JavaScript and reload
Revenue, Net:
Cost of Goods & Services Sold:
Gross Profit:
Selling, General & Admin Expense:
Research & Development Expense:
Total Operating Expenses:
Operating Income:
Income Taxes:
Net Income:
AAP Cash Flow
Enable JavaScript and reload
Operating Activities Net Income:
Depreciation, Depletion & Amortization:
Change in Accounts Receiveable:
Net Cash from Operations:
Repurchases/Buybacks Common Stock:
Issuance of Long-term Debt:
Cash Dividends Paid:
Net Cash from Financing Activities:
Property, Plant & Equipment Purchases:
Purchases of Businesses, Net of Cash:
Net Cash from Investing Activities:
Net Change in Cash & Equivalents:
AAP Balance Sheet
Enable JavaScript and reload
Cash and Cash Equivalents:
Short-Term Investments:
Accounts Receivable, Net:
Inventories:
Total Current Assets:
Property, Plant & Equipment, Net:
Total Assets:
Accounts Payable:
Current Portion of Long-Term Debt:
Total Short-Term Liabilities:
Long Term Debt, Non-Current Portion:
Total Long-Term Liabilities:
Total Liabilities:
COMPANY PROFILE
Nature of Operations and Basis of Presentation: Description of Business
Advance Auto Parts, Inc. and subsidiaries is a leading automotive aftermarket parts provider in North America, serving both professional installers (“professional”) and “do-it-yourself” (“DIY”) customers. The accompanying consolidated financial statements have been prepared by us and include the accounts of Advance Auto Parts, Inc., its wholly owned subsidiaries, Advance Stores Company, Incorporated (“Advance Stores”) and Neuse River Insurance Company, Inc., and their subsidiaries (collectively referred to as “Advance,” “we,” “us” or “our”).
As of January 1, 2022, we operated a total of 4,706 stores and 266 branches primarily within the United States, with additional locations in Canada, Puerto Rico and the U.S. Virgin Islands. In addition, as of January 1, 2022, we served 1,317 independently owned Carquest branded stores across the same geographic locations served by our stores and branches in addition to Mexico and various Caribbean islands. Our stores operate primarily under the trade names “Advance Auto Parts,” “Carquest” and “Autopart International,” and our branches operate under the “Worldpac” trade name.
Accounting Period
Our fiscal year ends on the Saturday closest to December 31 st . All references herein for the years “2021,” “2020” and “2019” represent the fiscal year ended January 1, 2022, which consisted of 52 weeks, fiscal year ended January 2, 2021, which consisted of 53 weeks, and fiscal year ended December 28, 2019, which consisted of 52 weeks.
Basis of Presentation
The consolidated financial statements include the accounts of Advance prepared in accordance with accounting principles generally accepted in the United States of America (“GAAP”). All intercompany balances and transactions have been eliminated in consolidation.
Use of Estimates
The preparation of financial statements in conformity with GAAP requires management to make estimates and assumptions that affect the reported amounts of assets and liabilities and the disclosure of contingent assets and liabilities at the date of the financial statements and the reported amounts of revenues and expenses during the reporting period. Actual results could differ materially from those estimates.
Free historical financial statements for Advance Auto Parts Inc. See how revenue, income, cash flow, and balance sheet financials have changed over 65 quarters since 2010. Compare with AAP stock chart to see long term trends.
Data imported from Advance Auto Parts Inc SEC filings. Check original filings before making any investment decision.