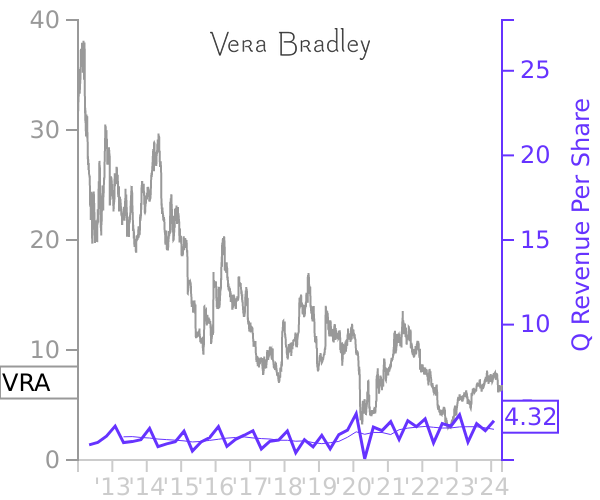
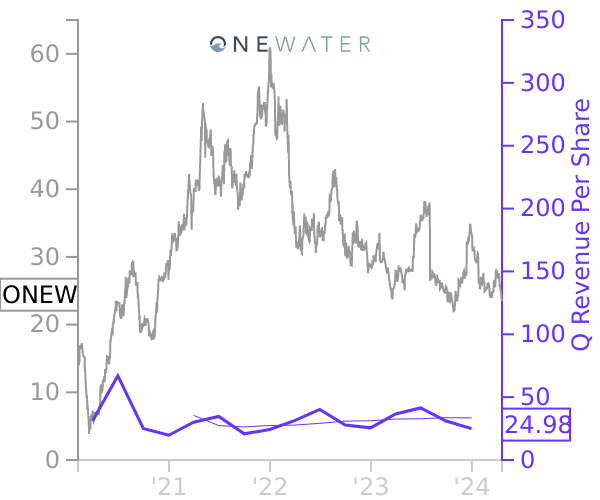
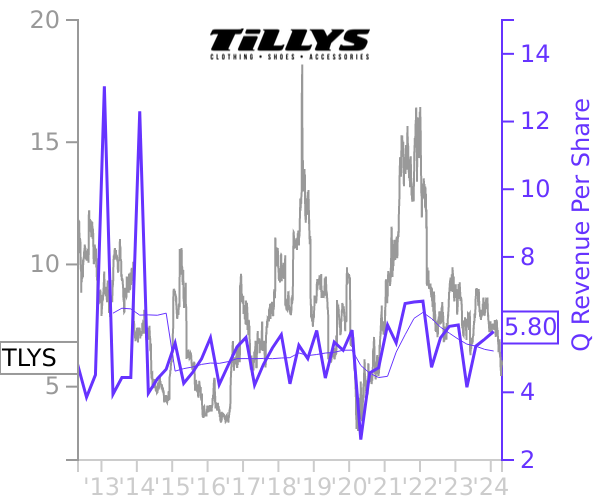
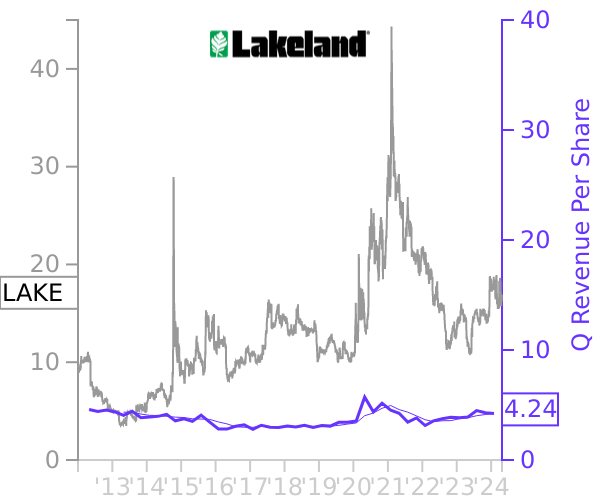
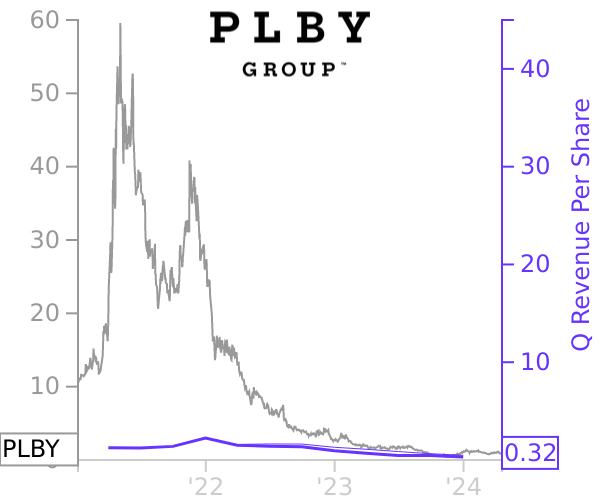
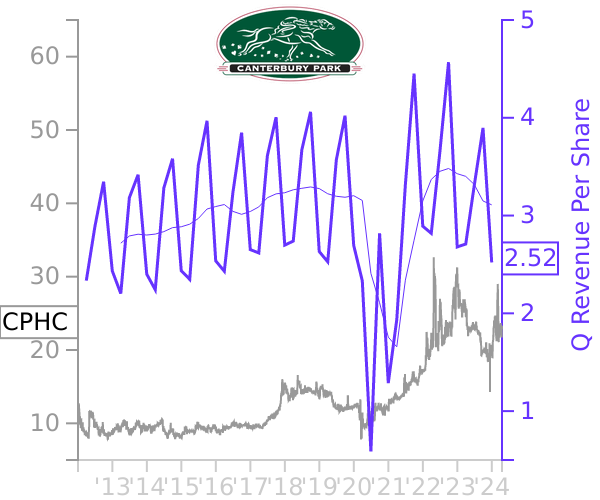
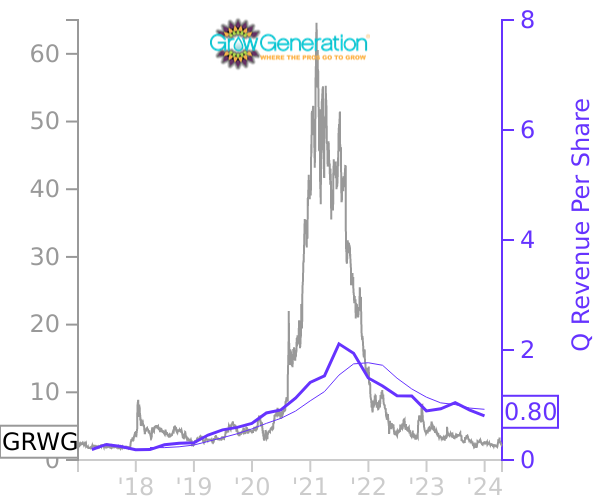
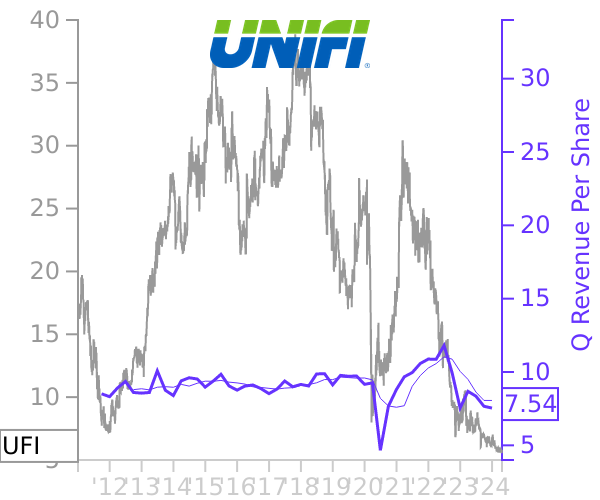
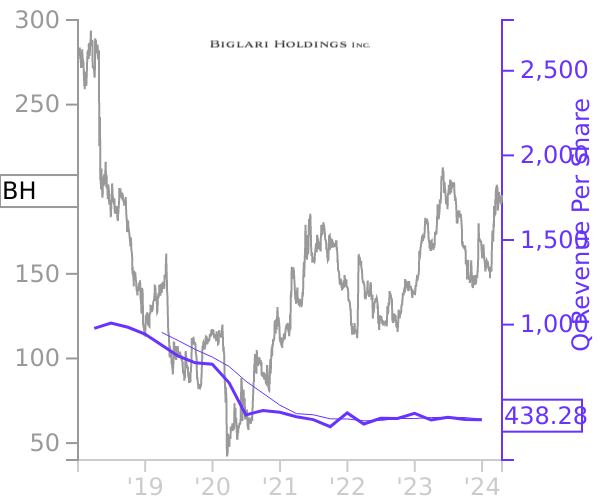
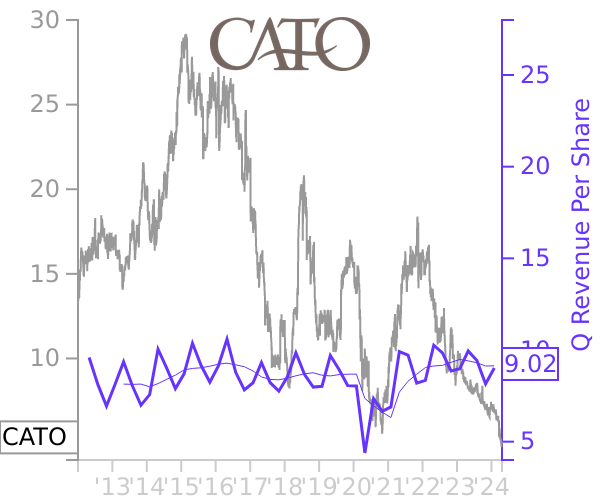
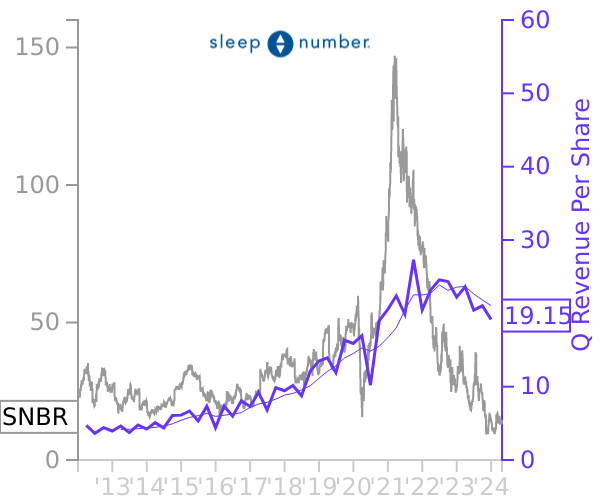
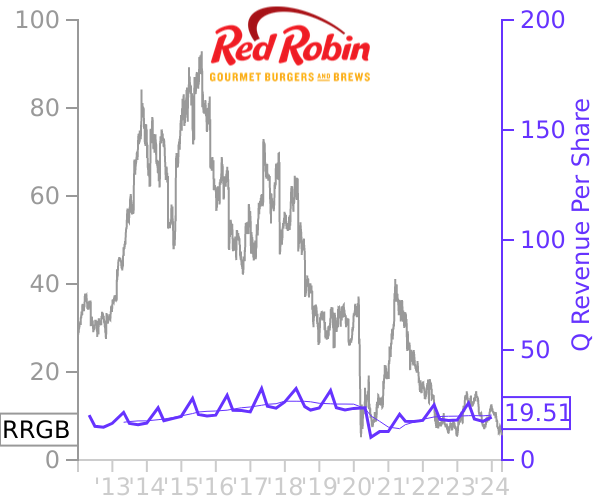
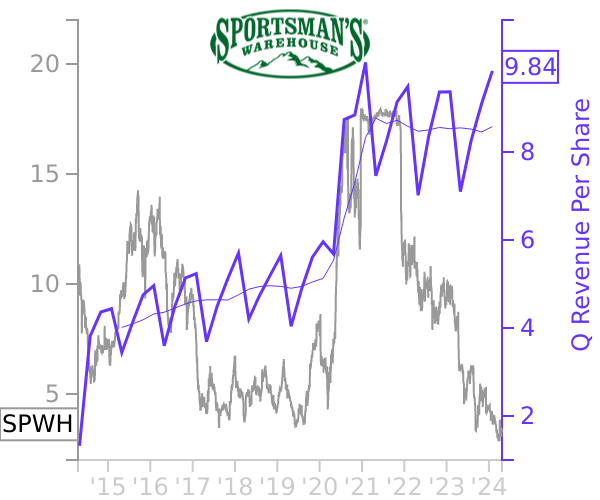
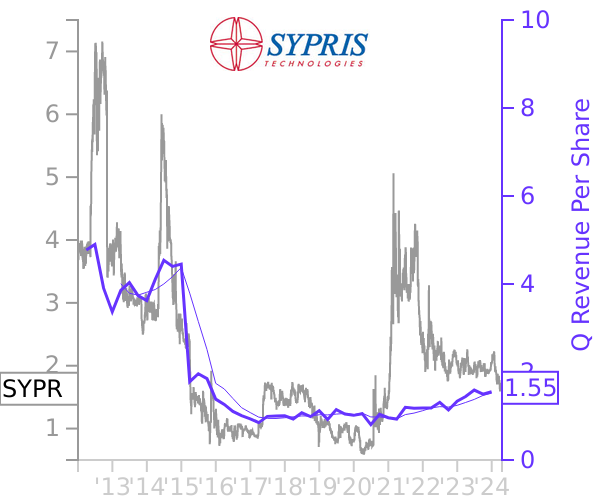
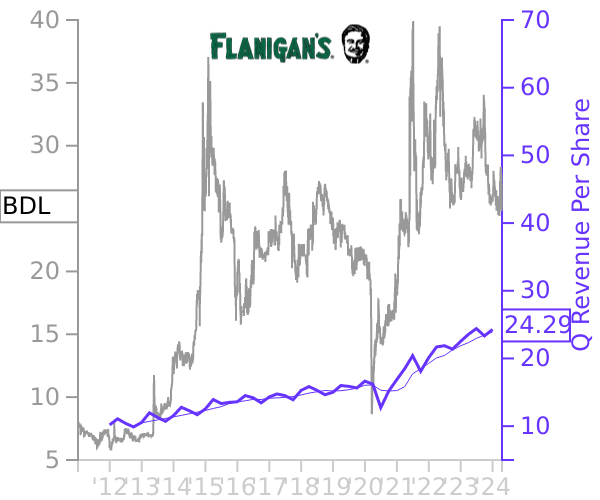
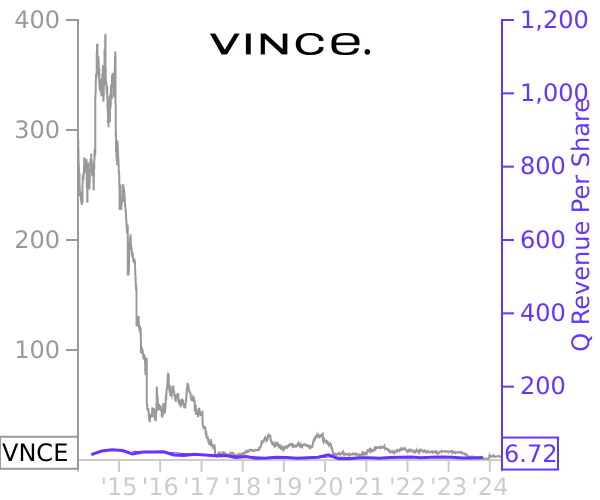
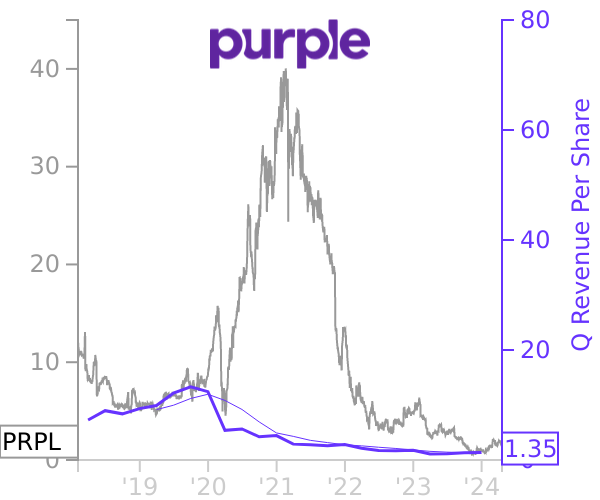
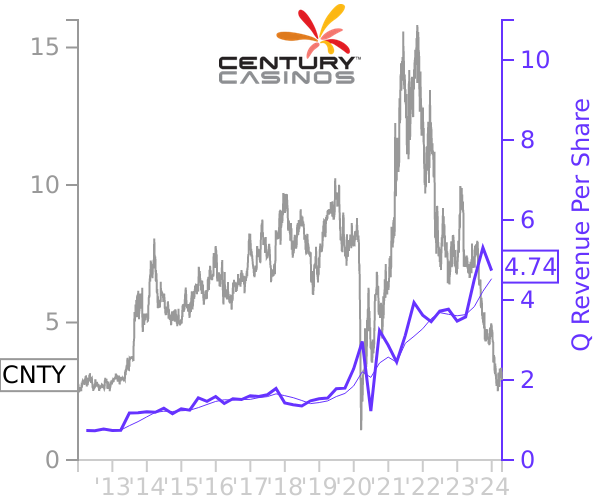
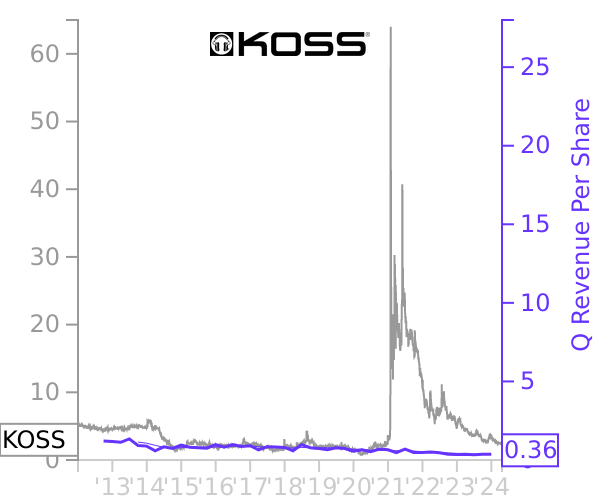
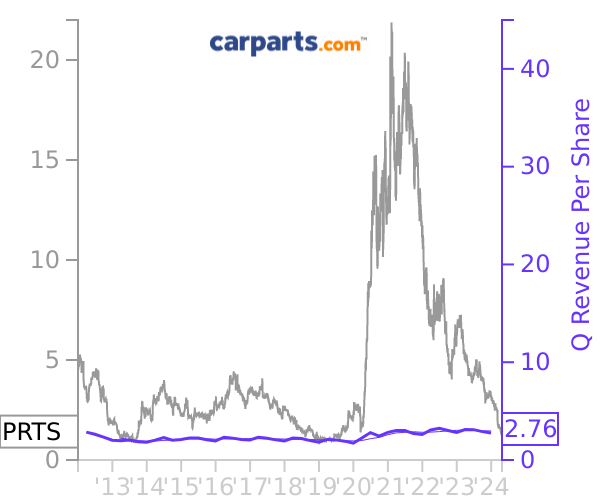
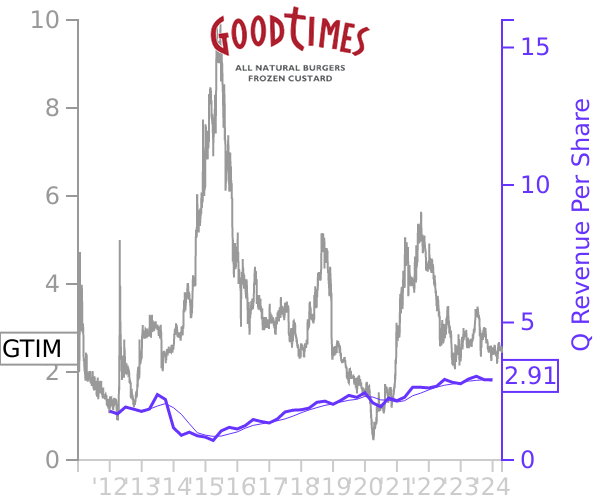
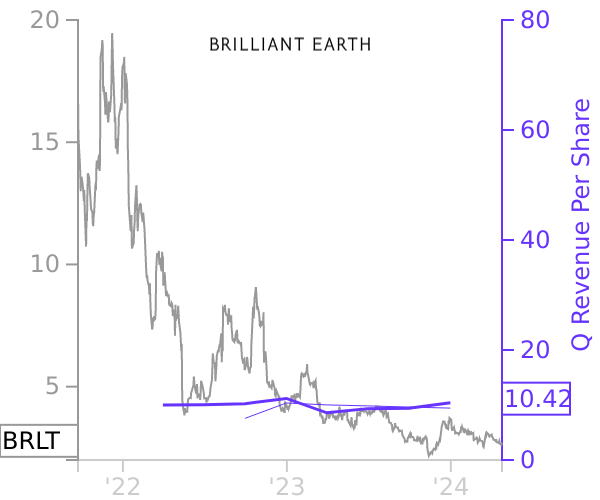
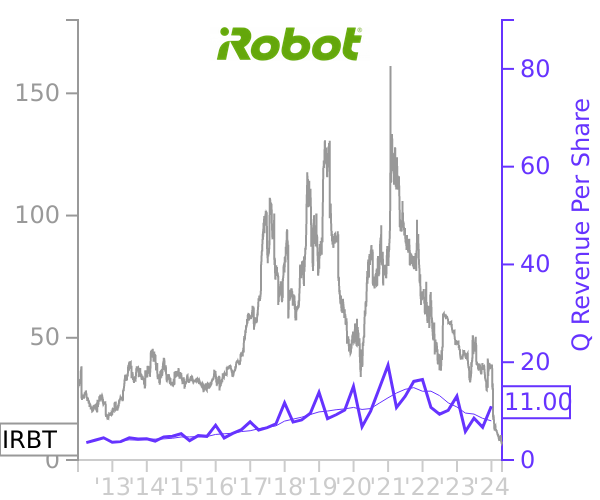
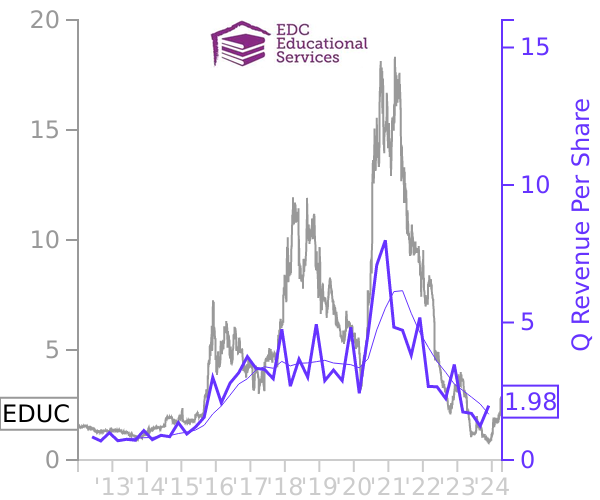
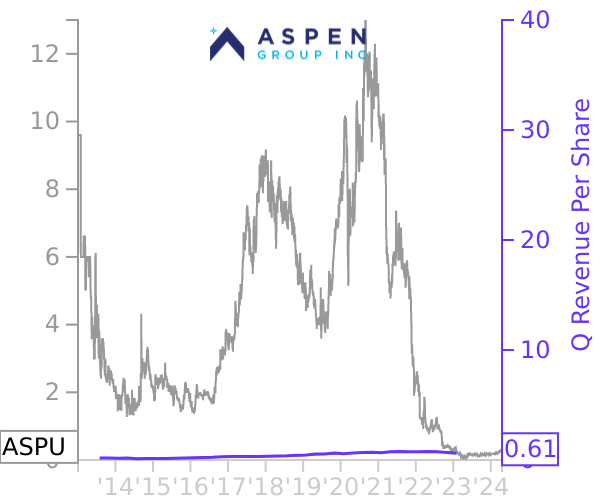
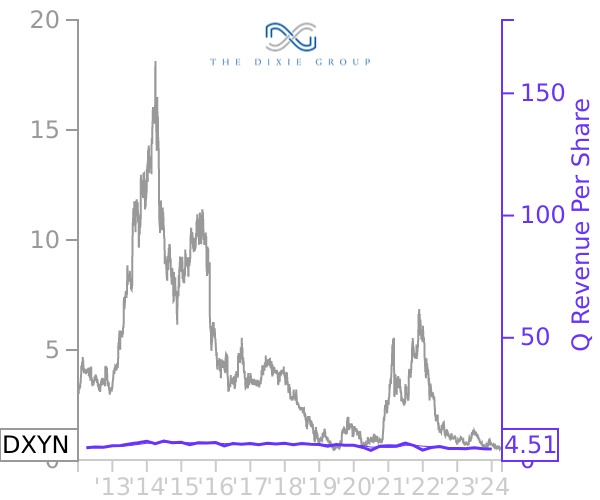
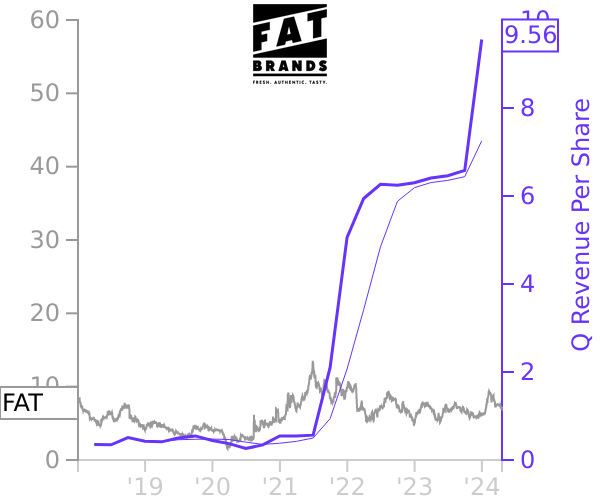
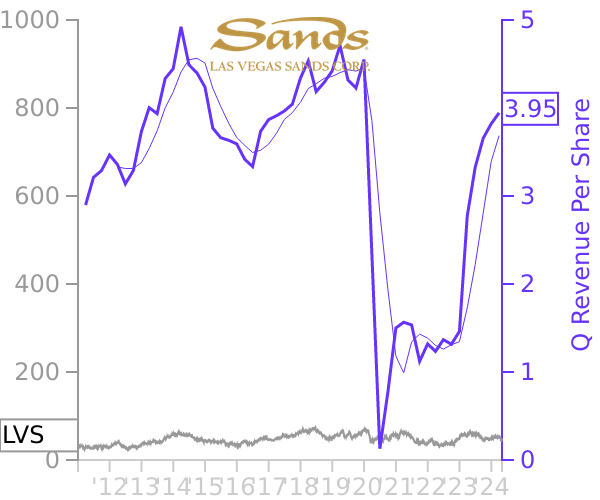
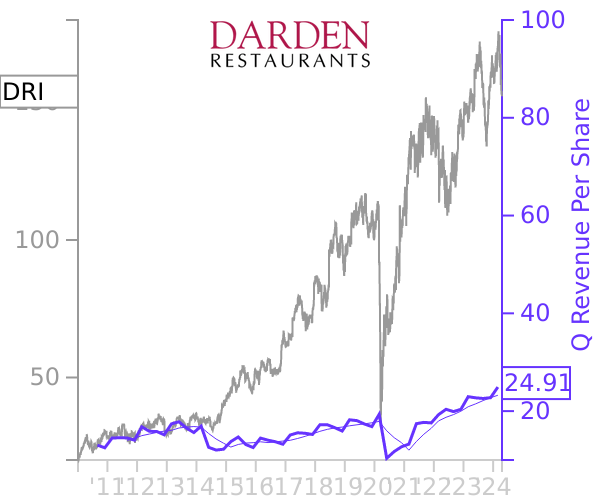
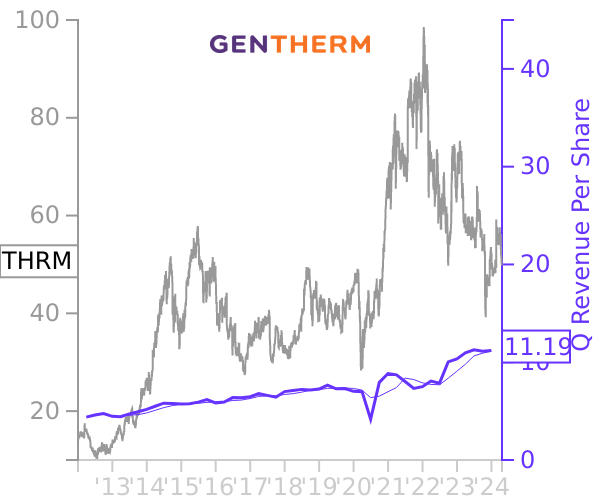
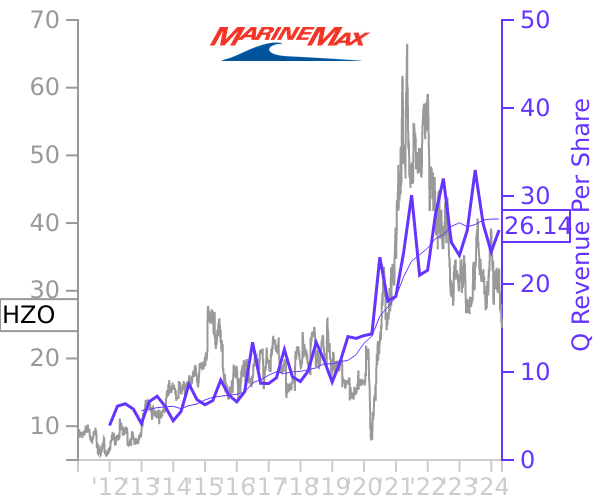
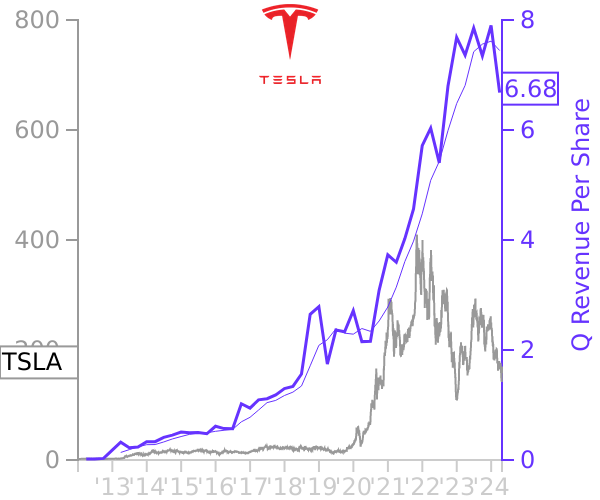
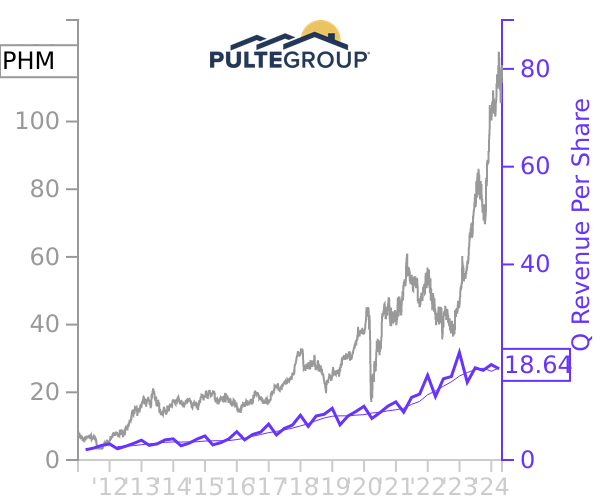
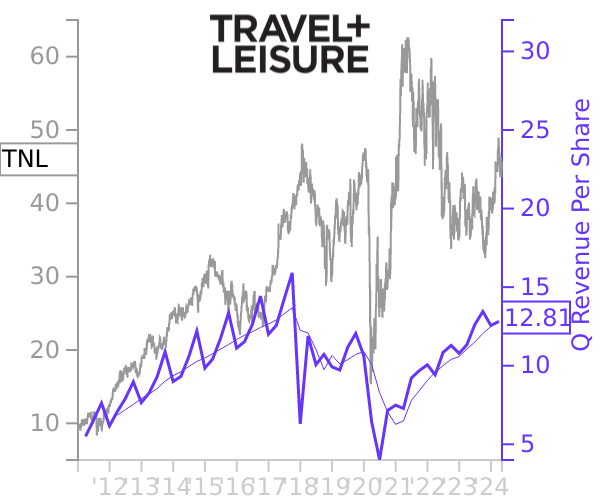
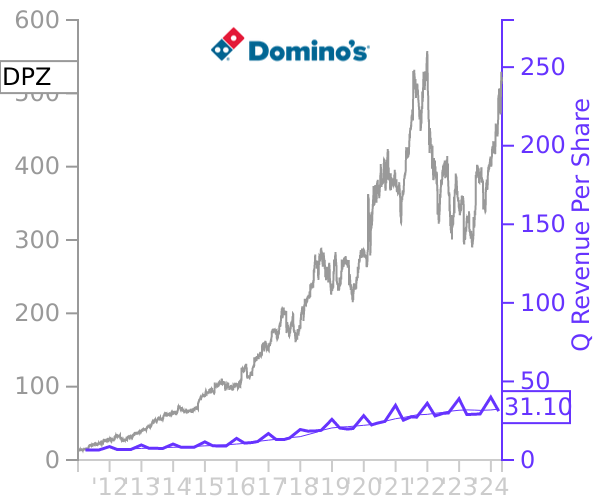
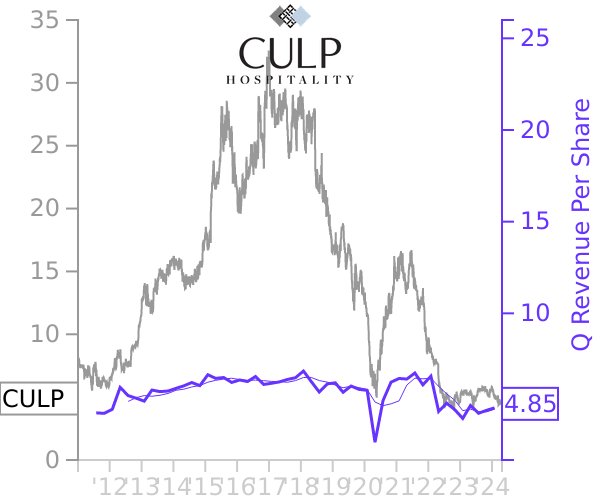
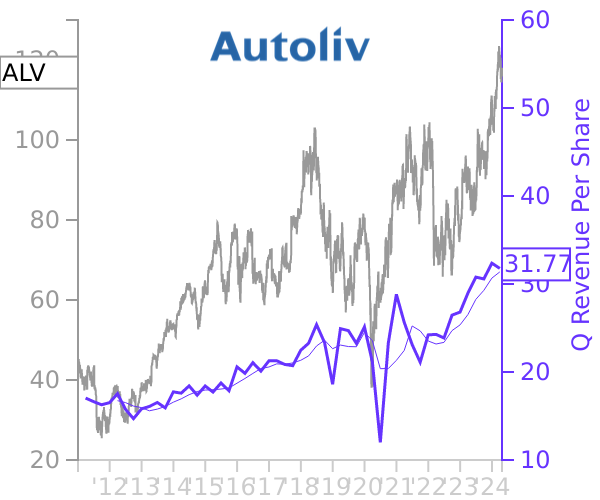
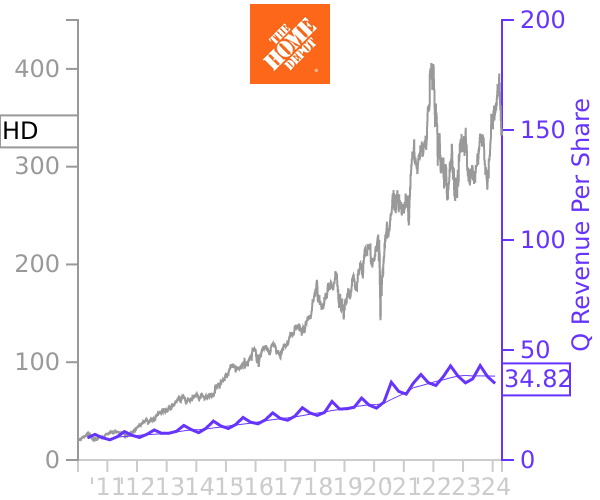
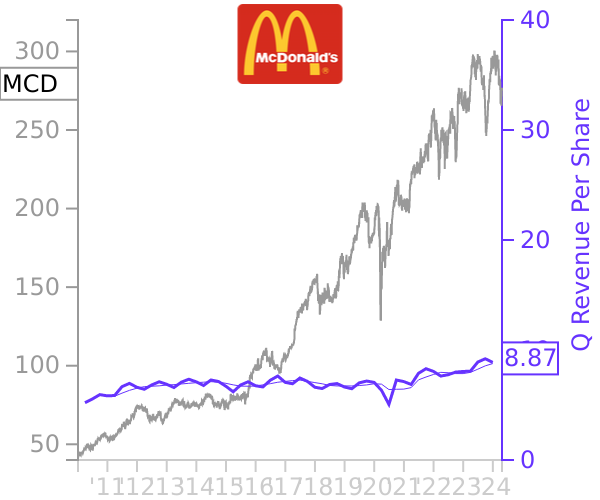
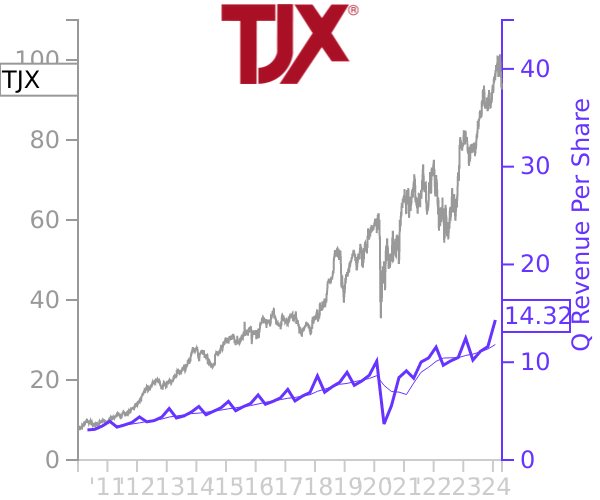
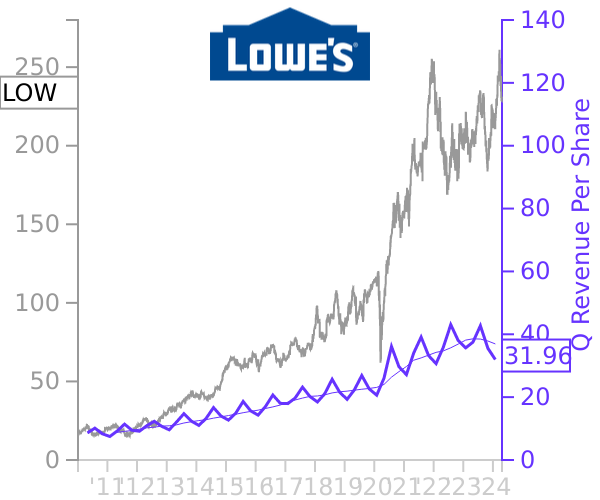
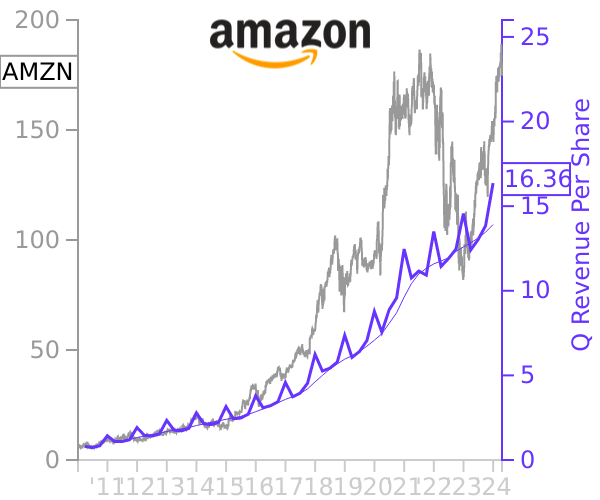
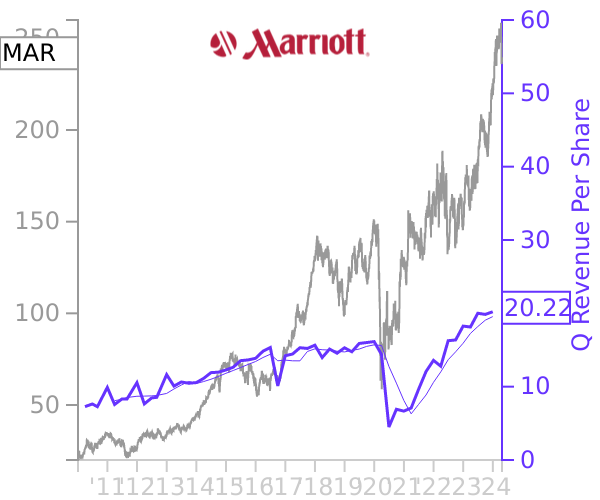
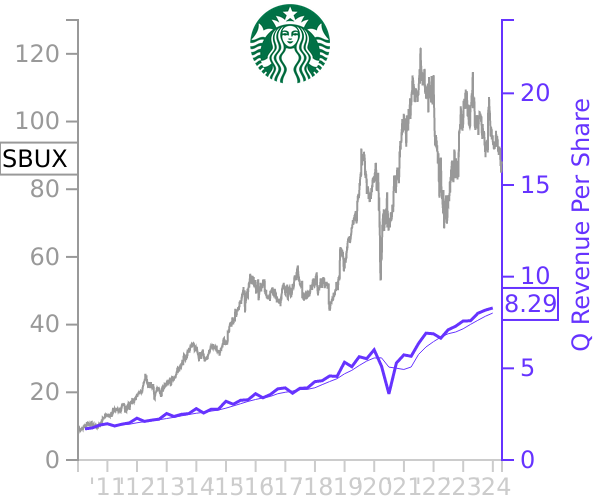
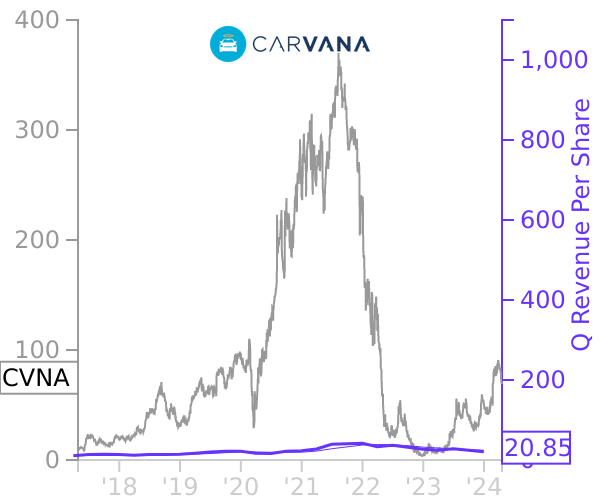
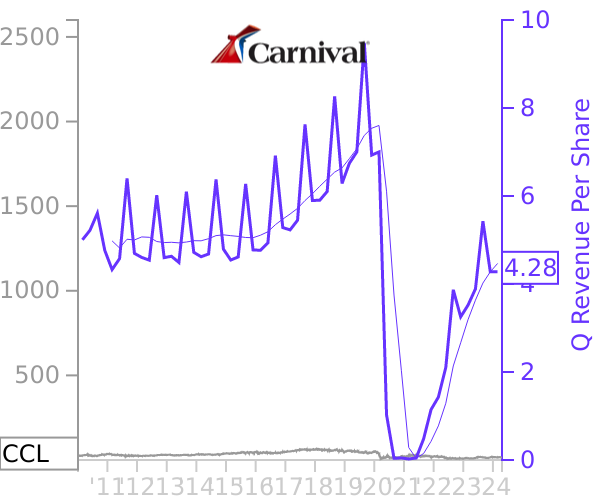
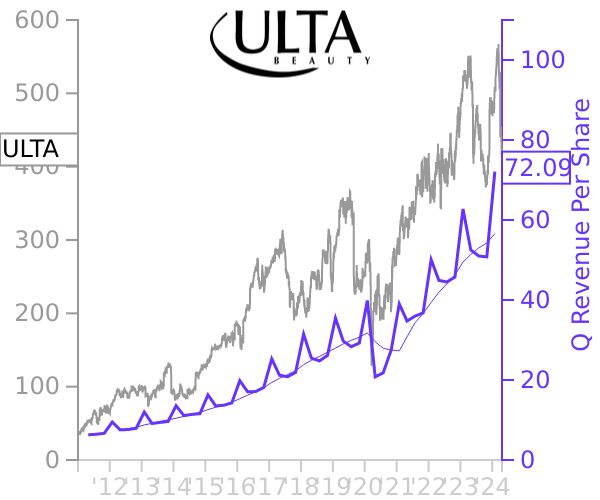
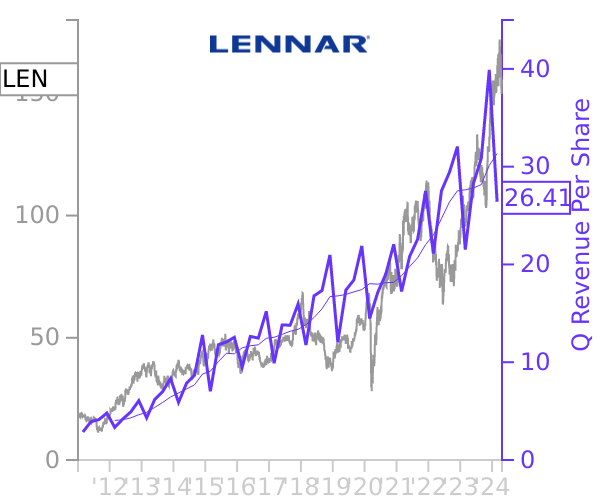
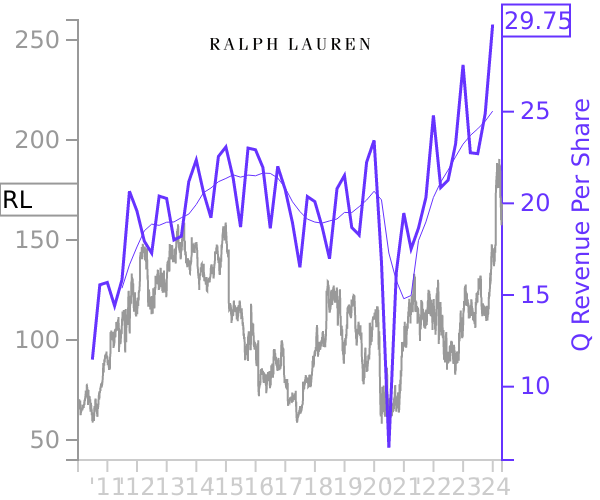
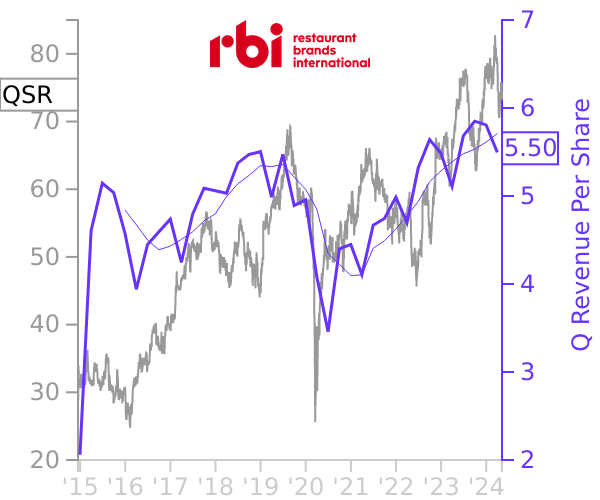
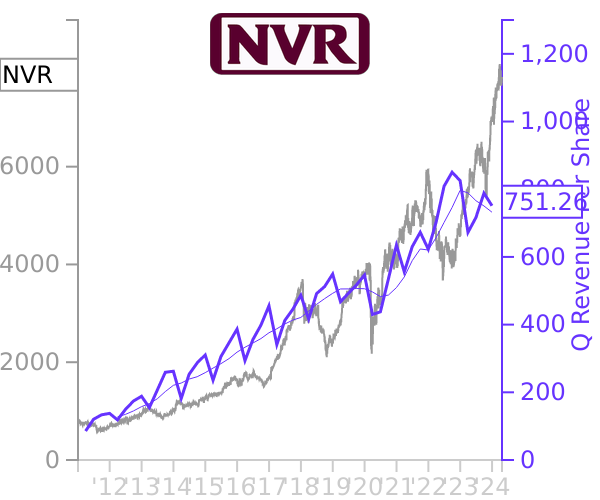
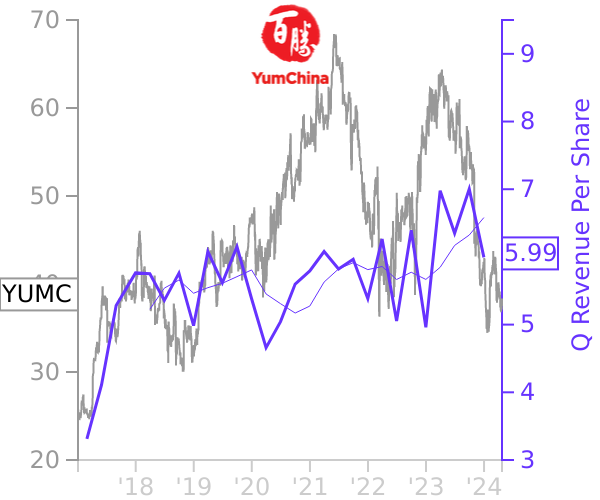
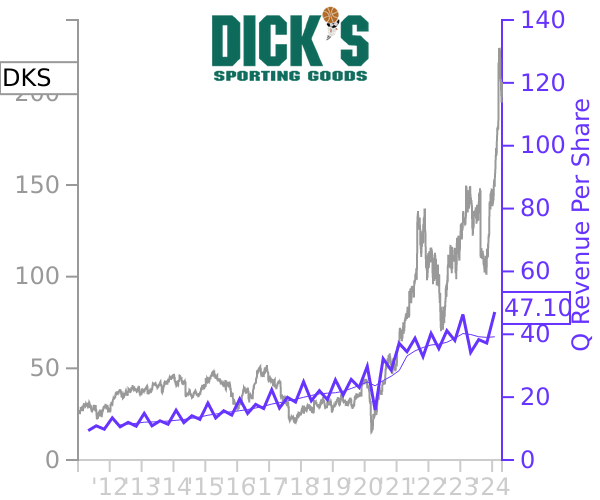
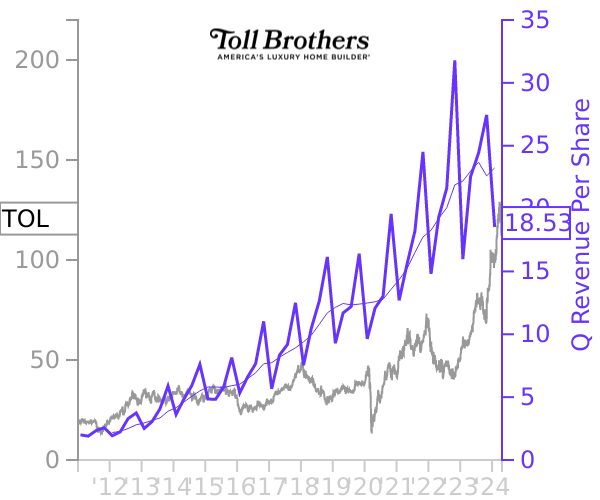
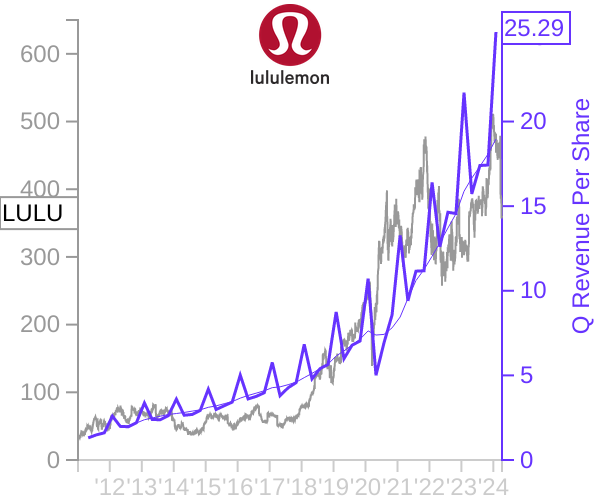
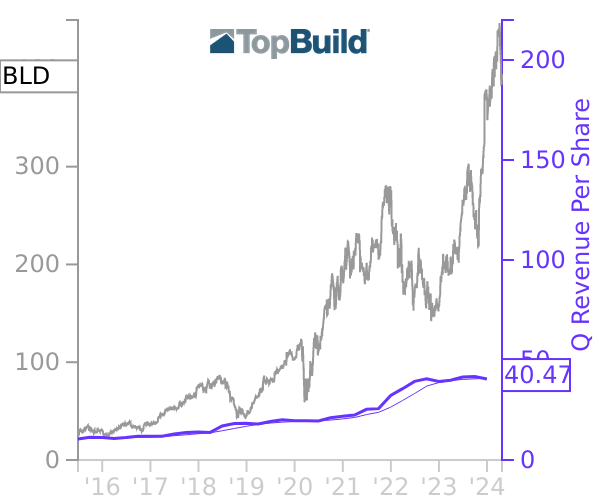
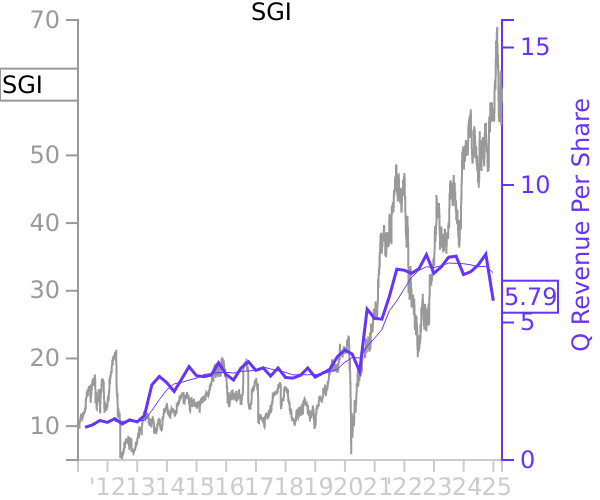
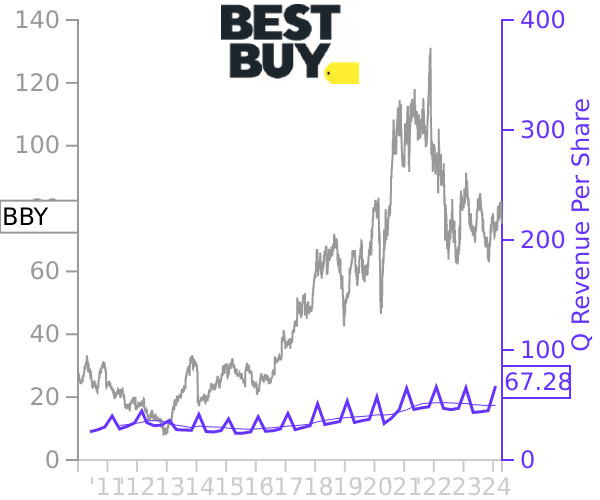
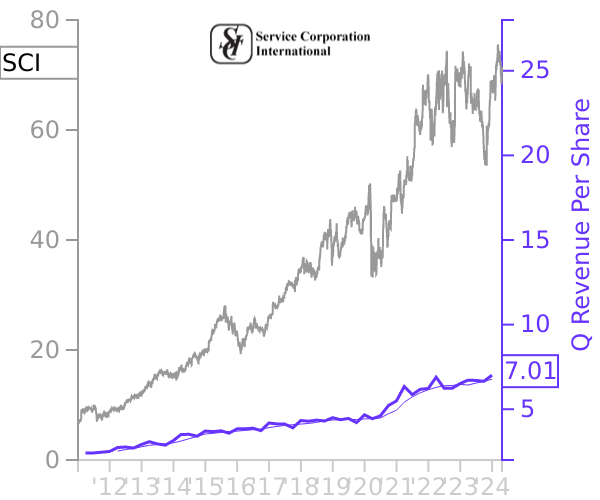
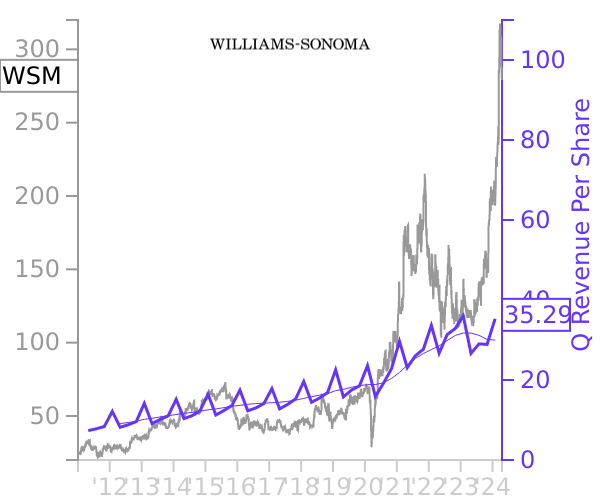
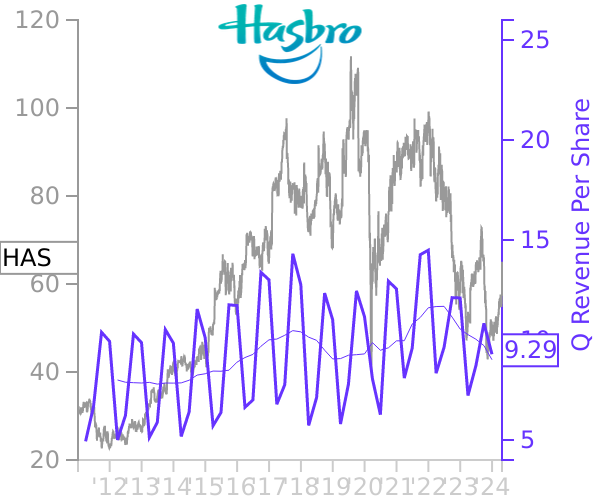
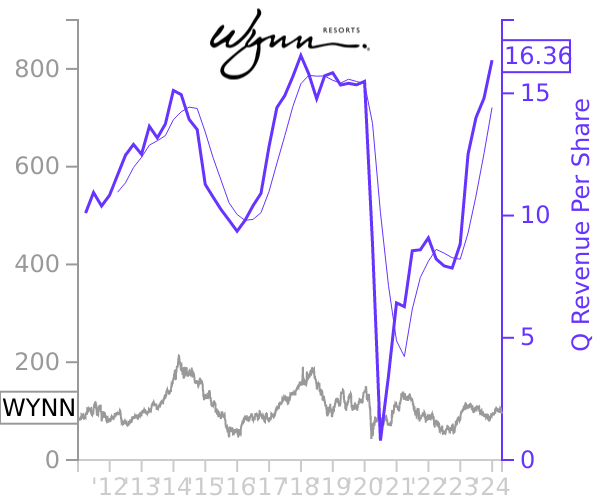
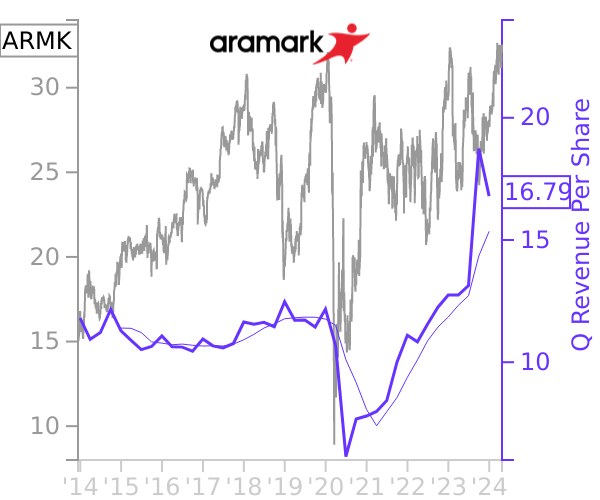
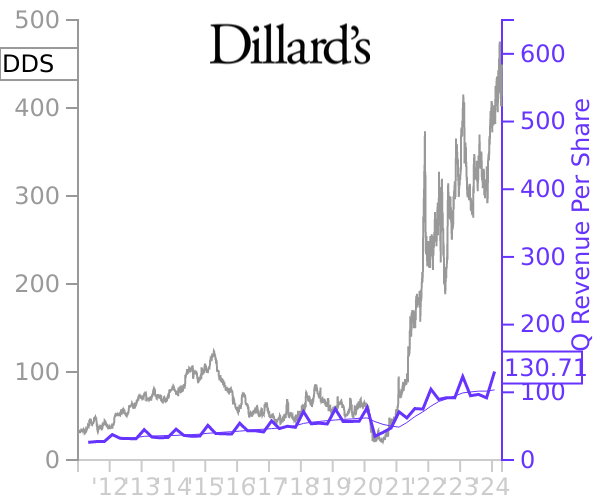
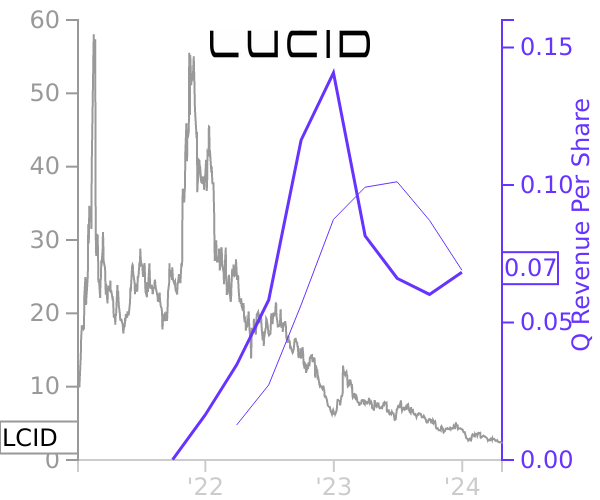
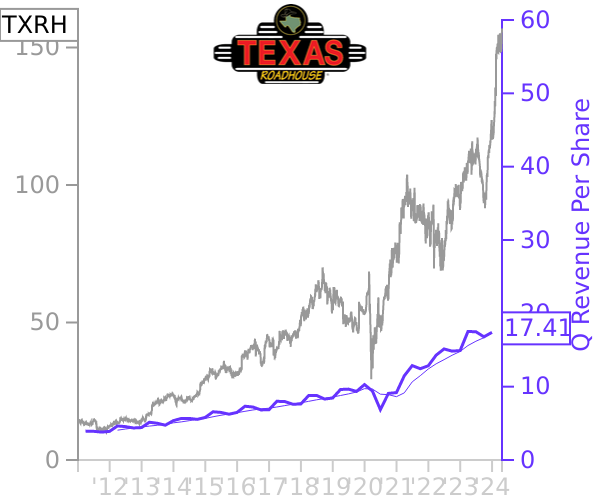
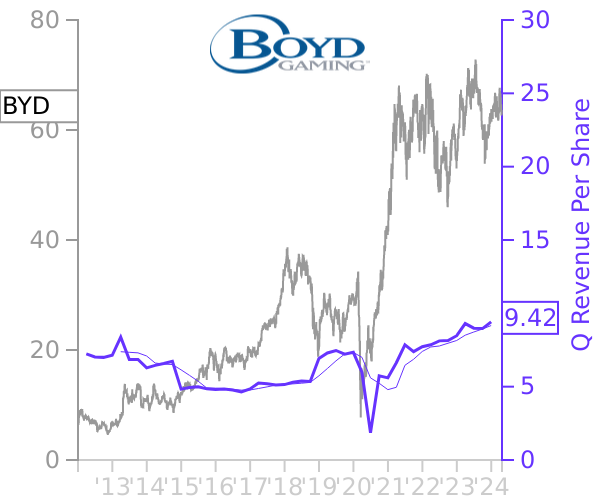
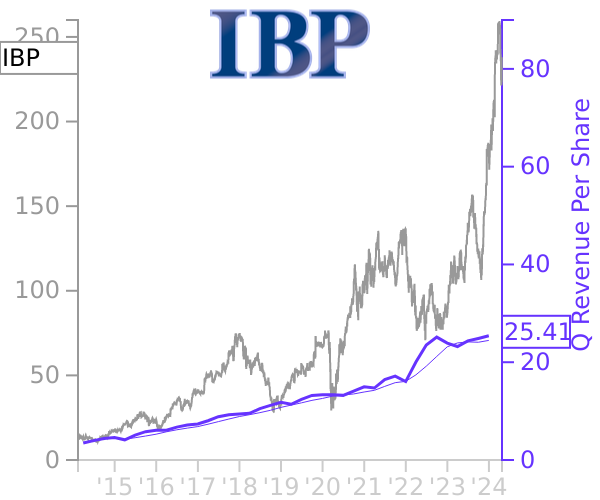
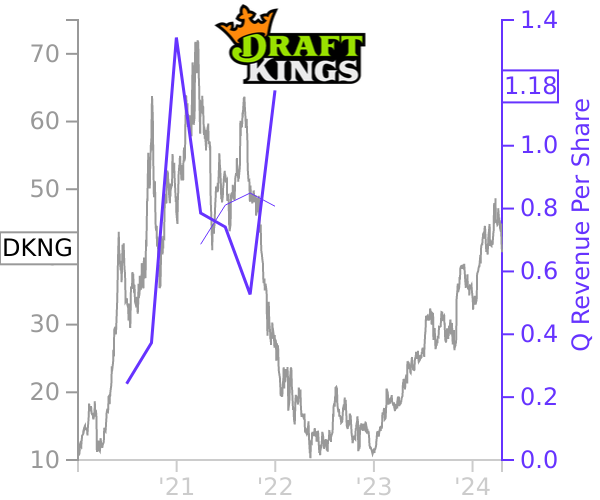
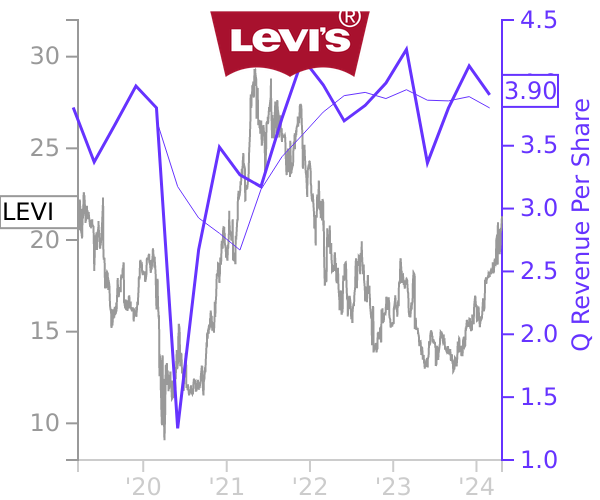
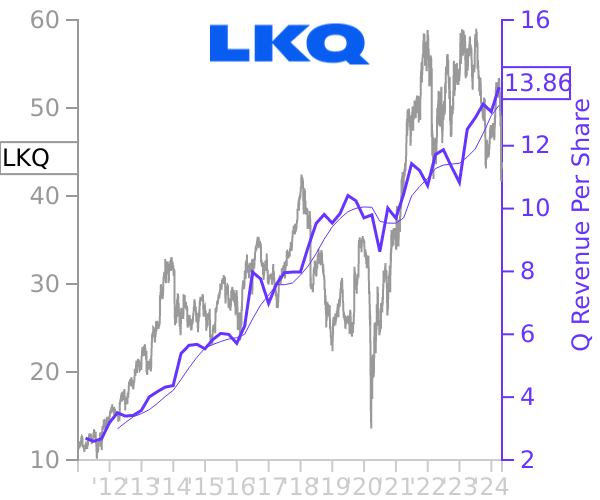
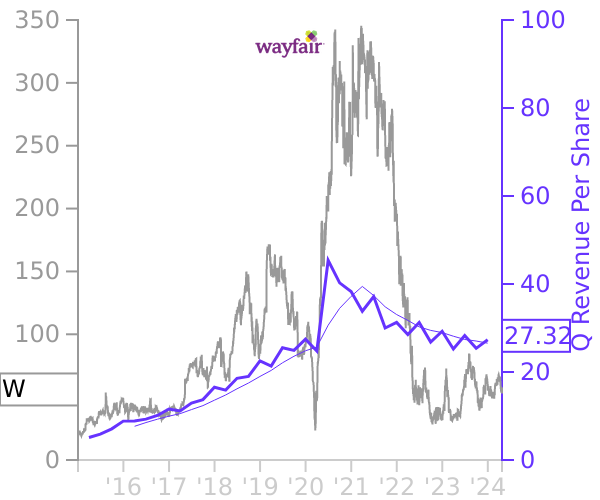
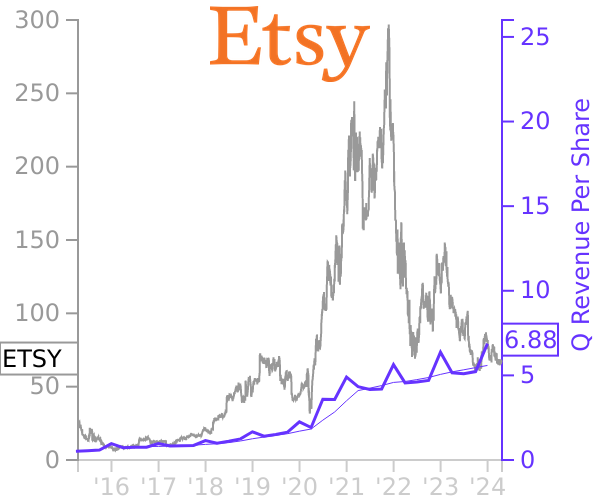
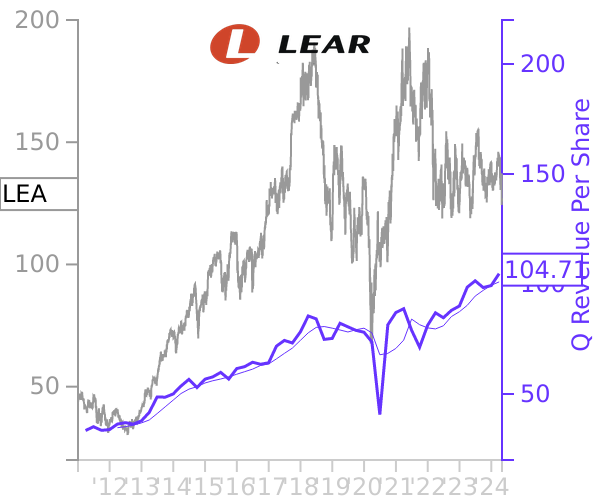
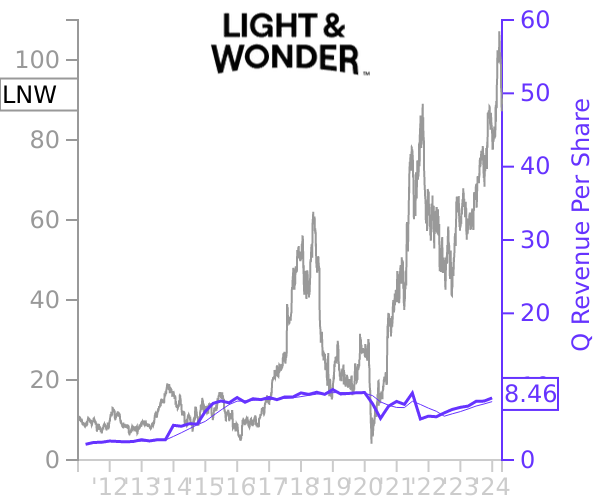
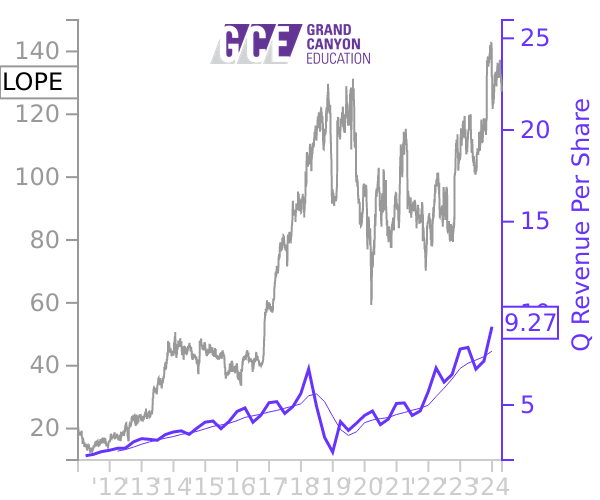
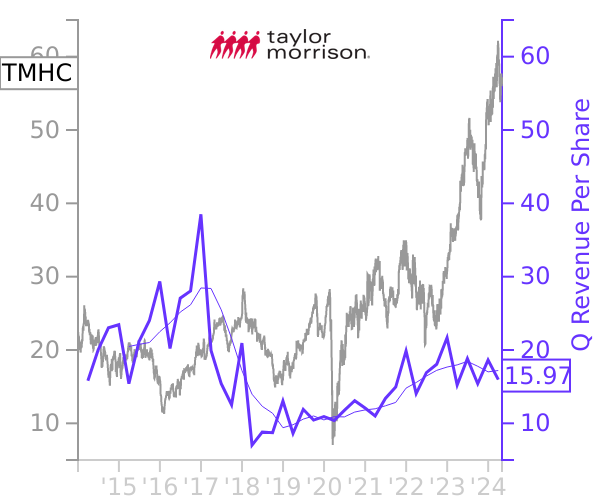
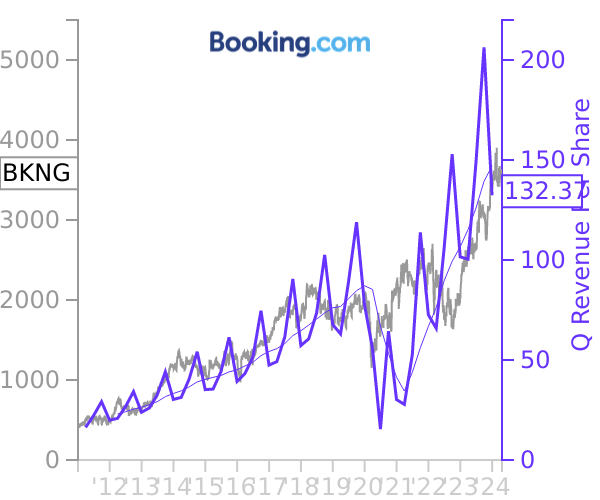
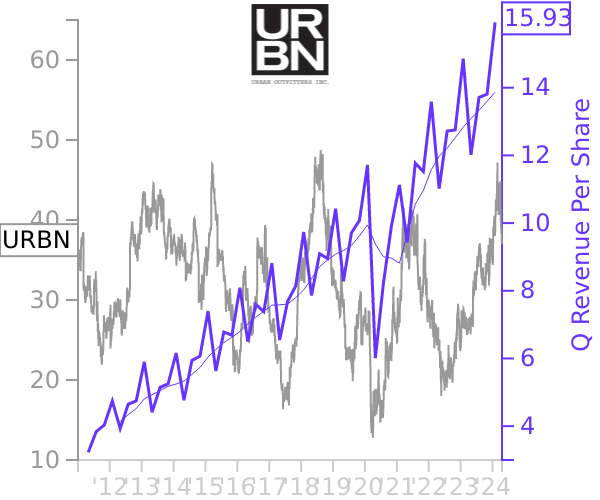
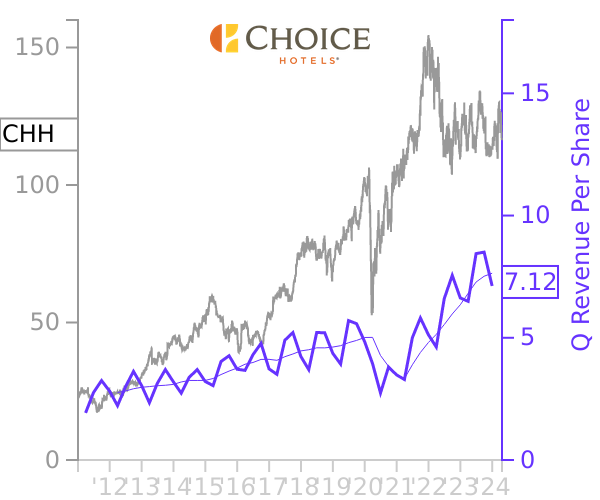
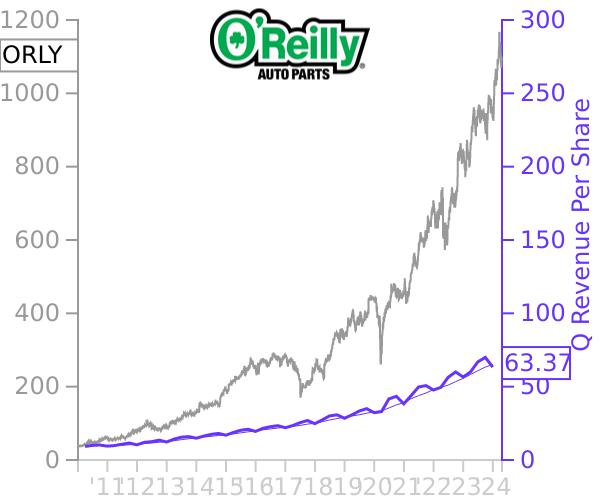
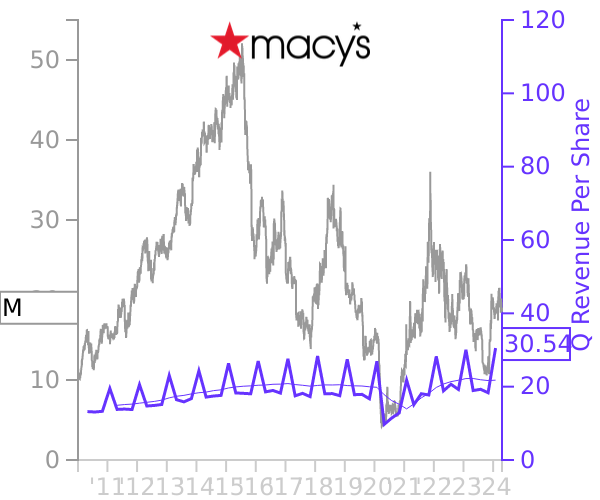
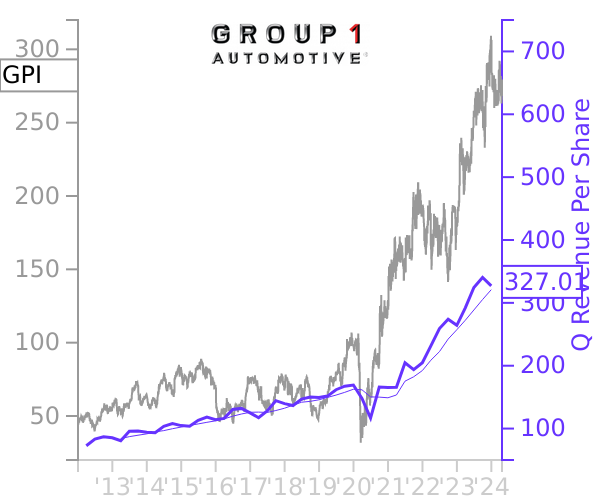
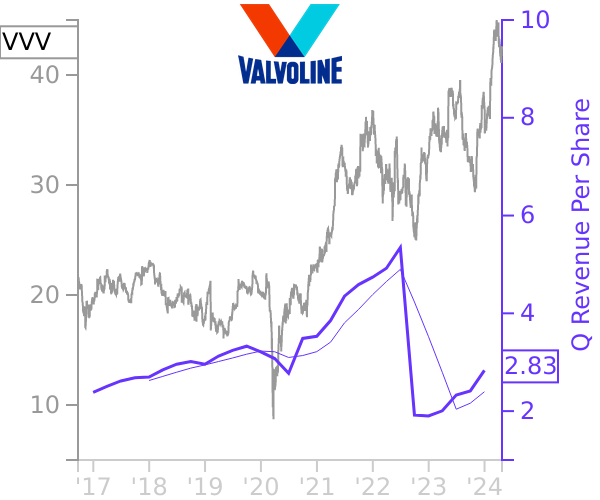
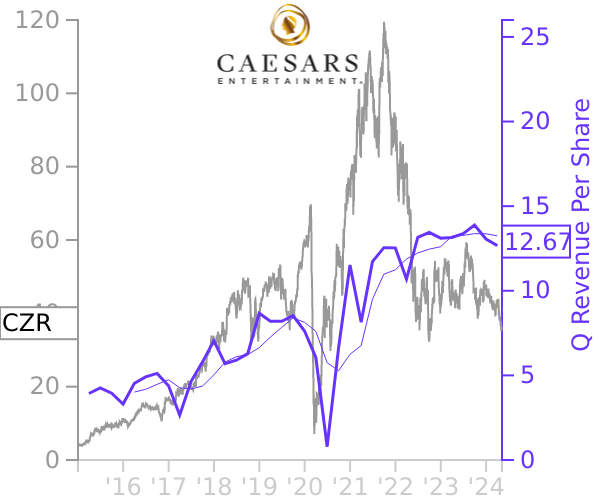
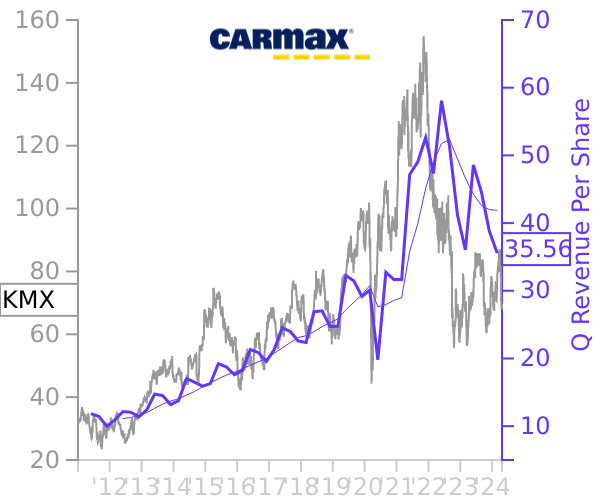
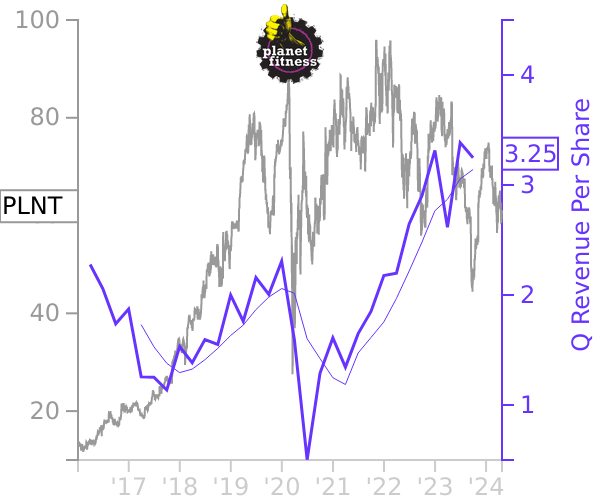
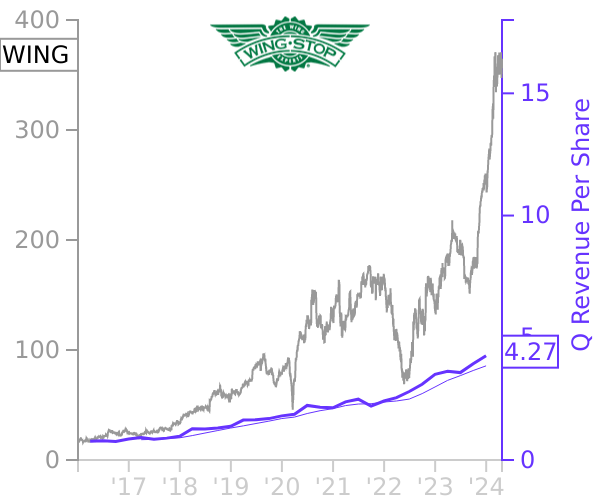
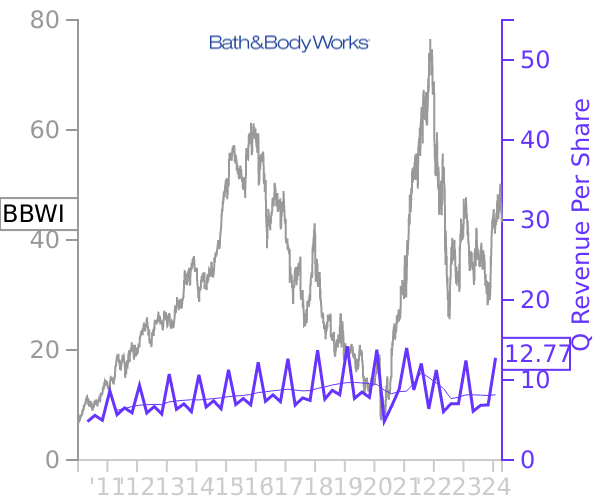
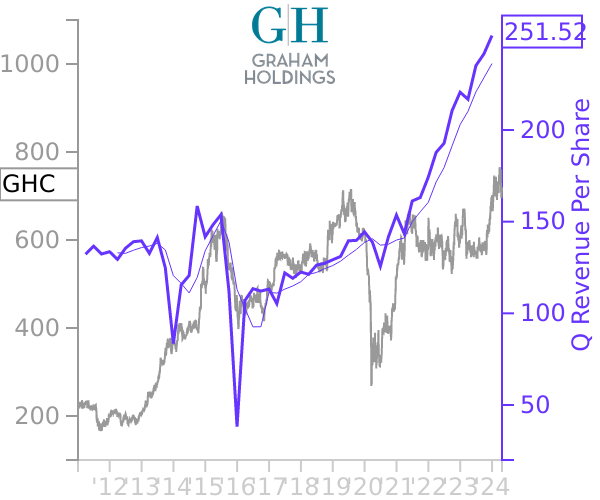
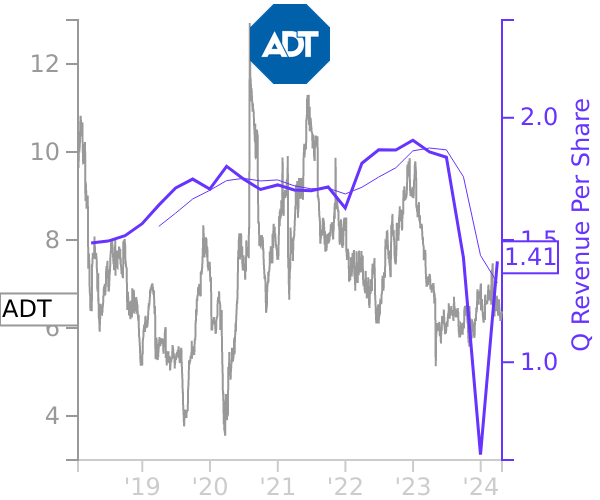
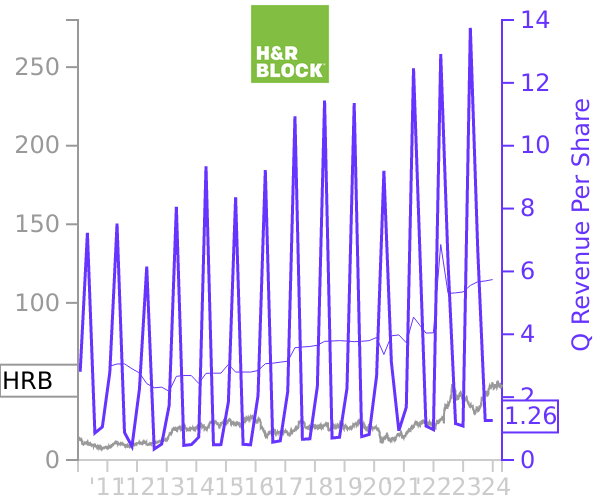
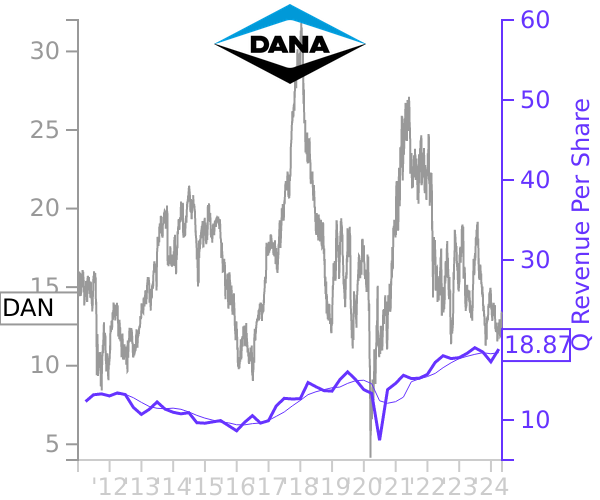
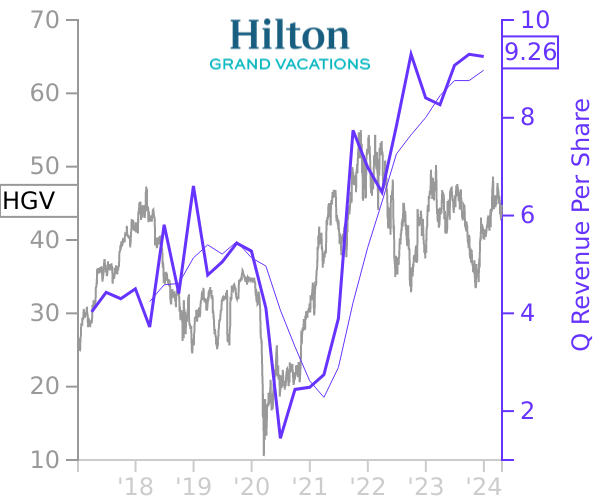
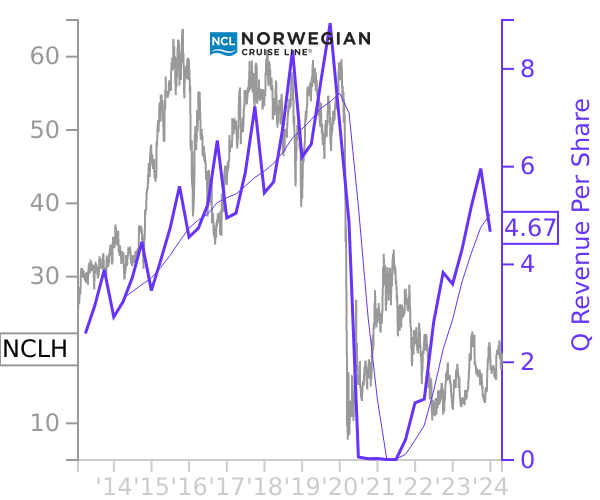
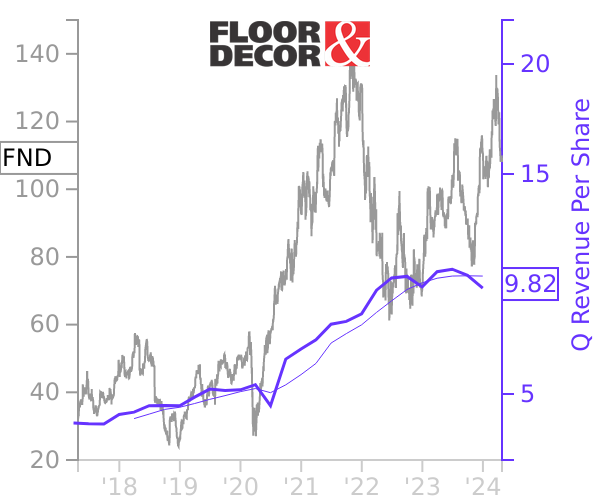
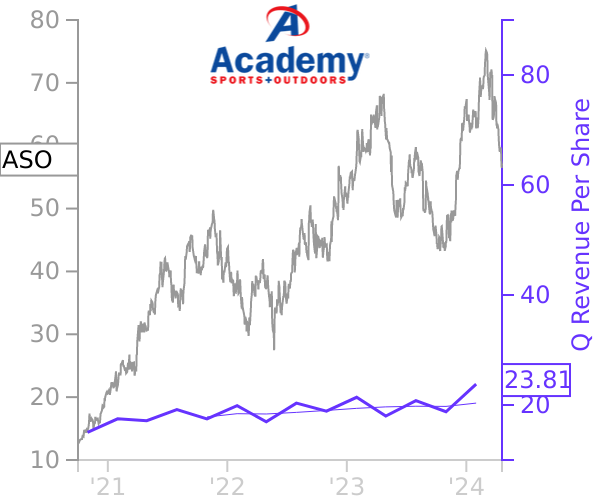
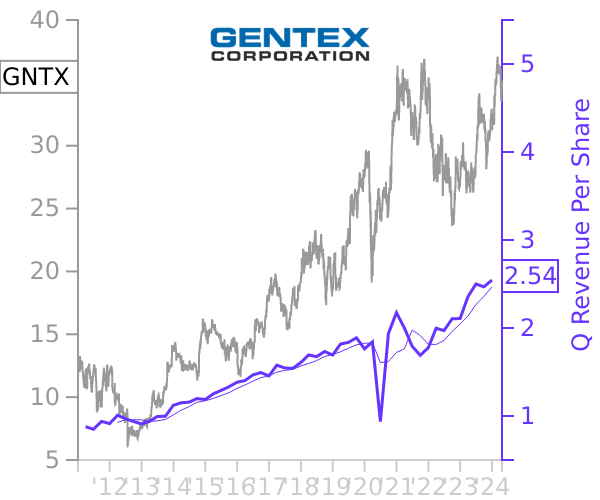
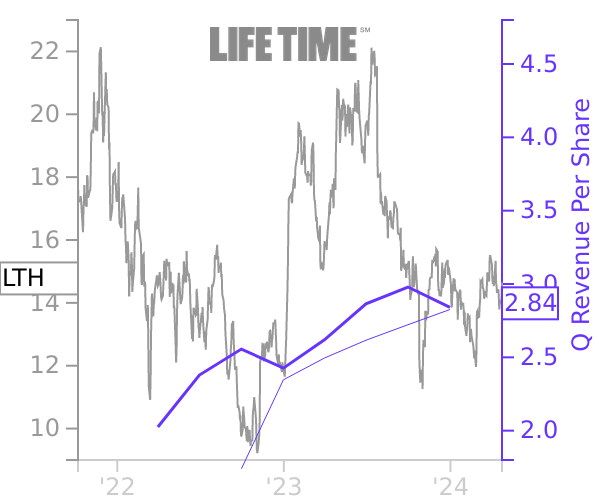
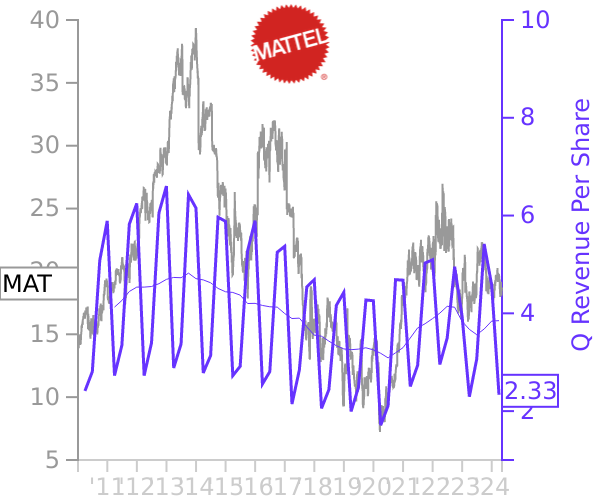
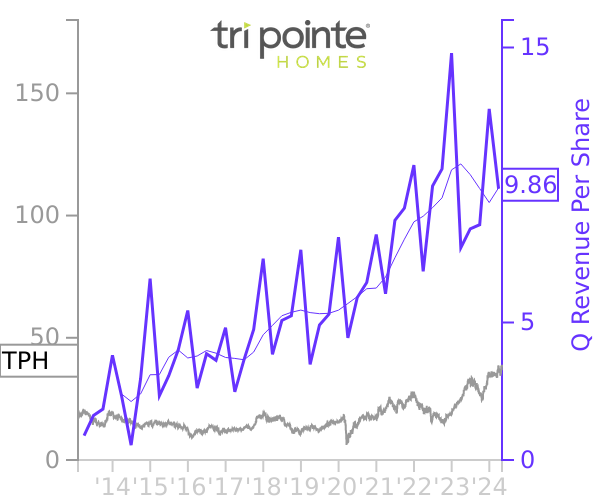
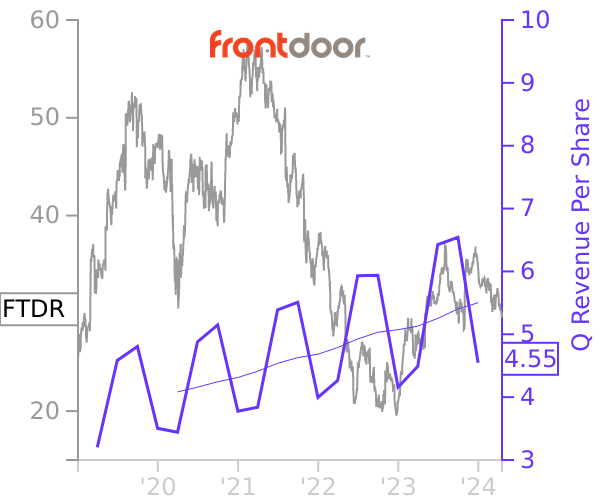
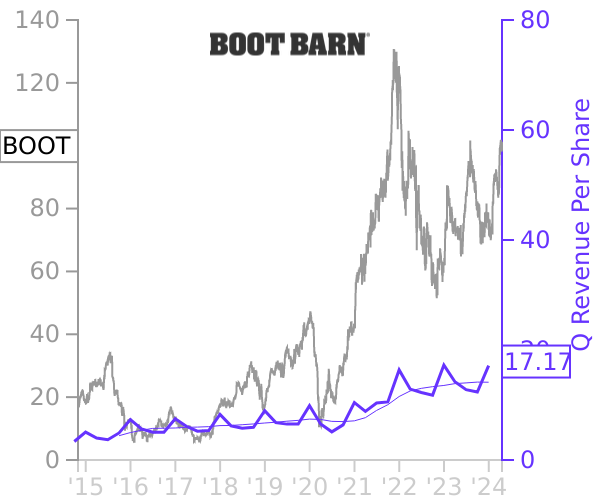
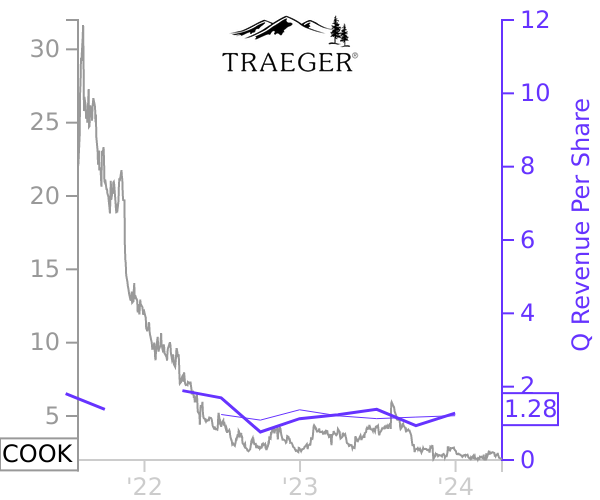
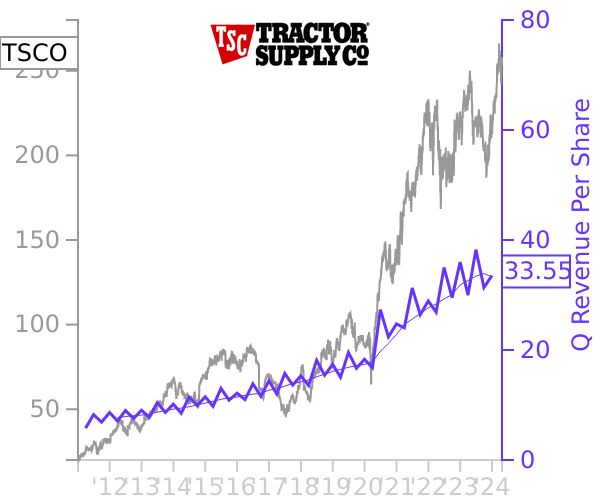
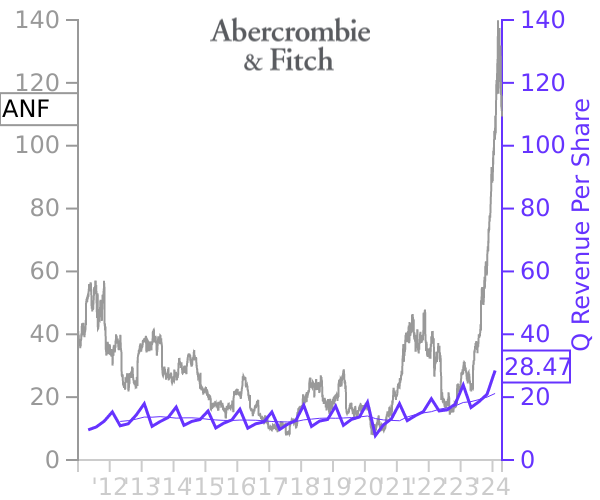
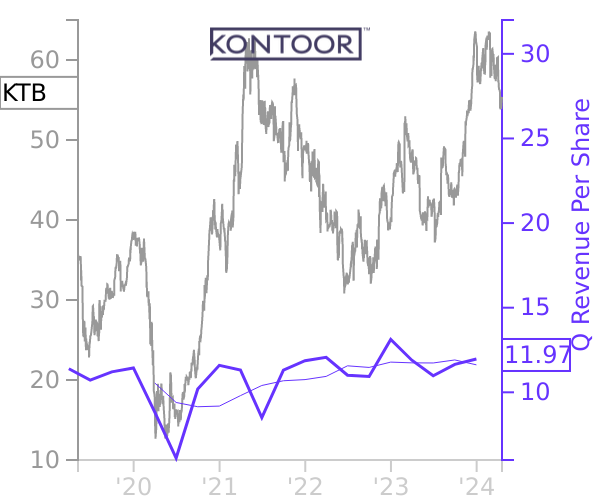
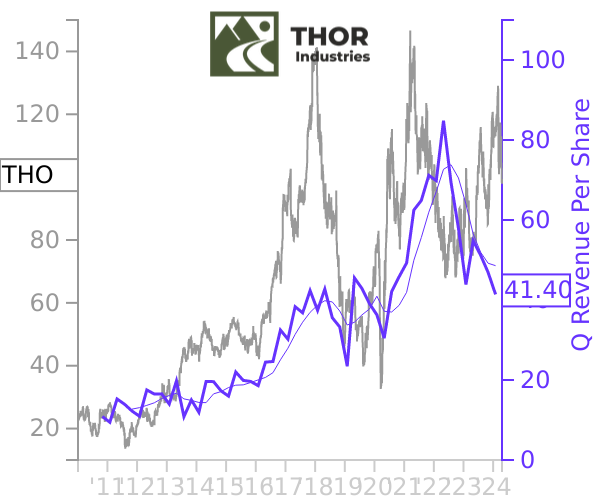
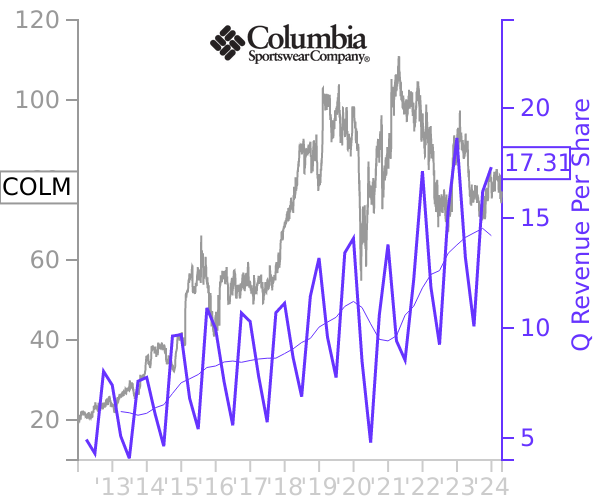
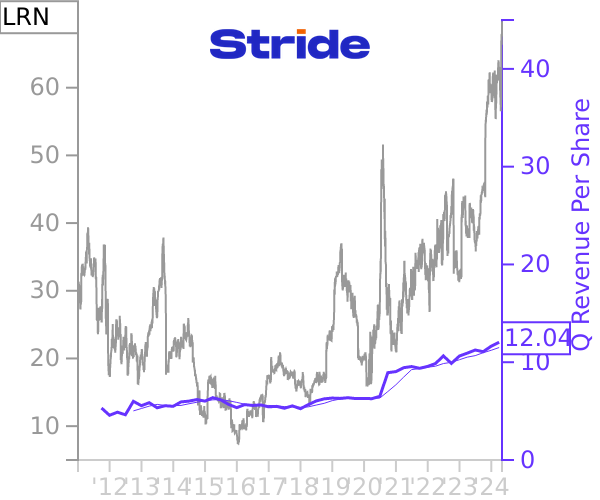
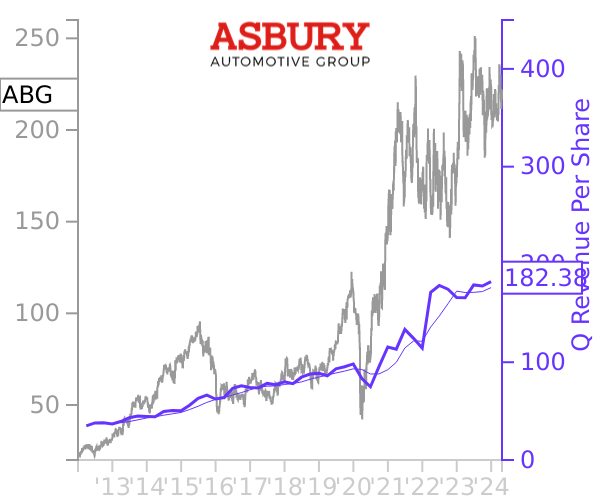
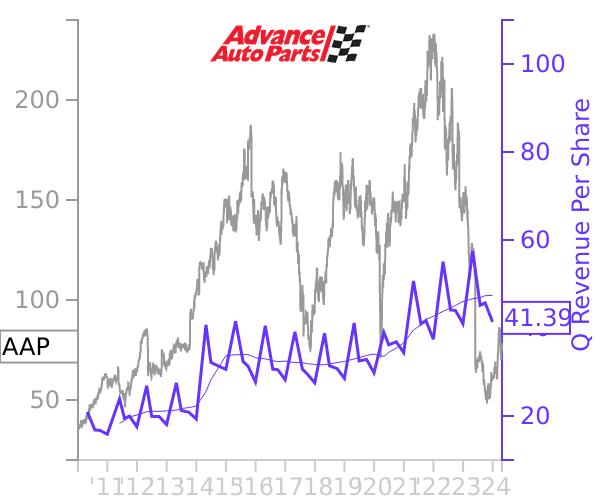
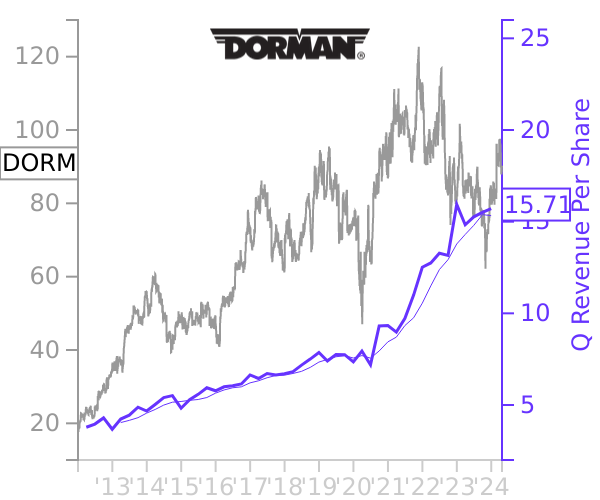
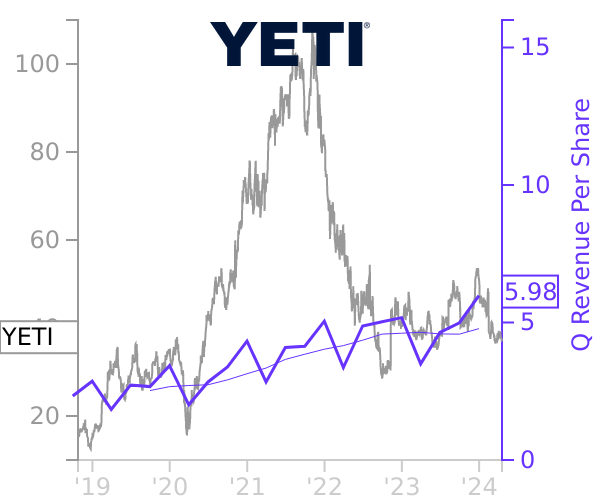
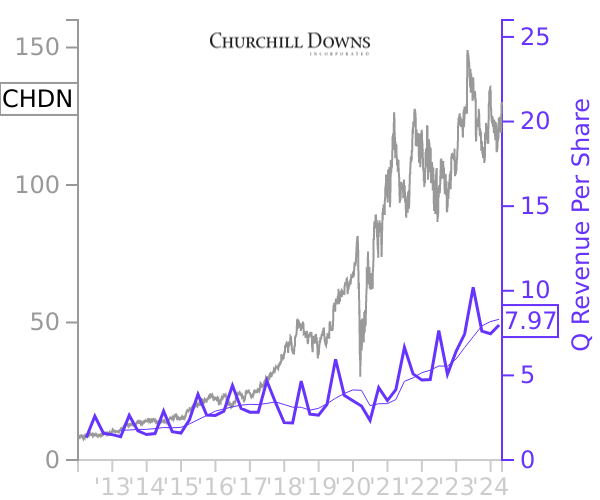
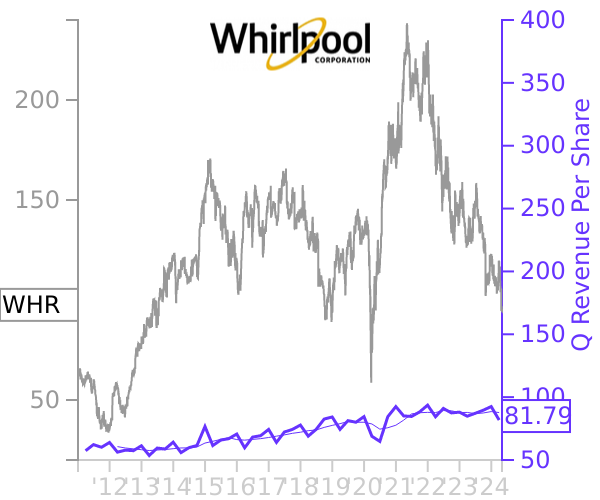
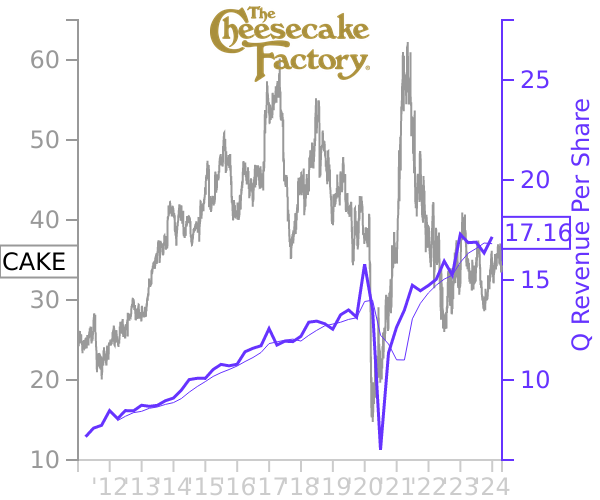
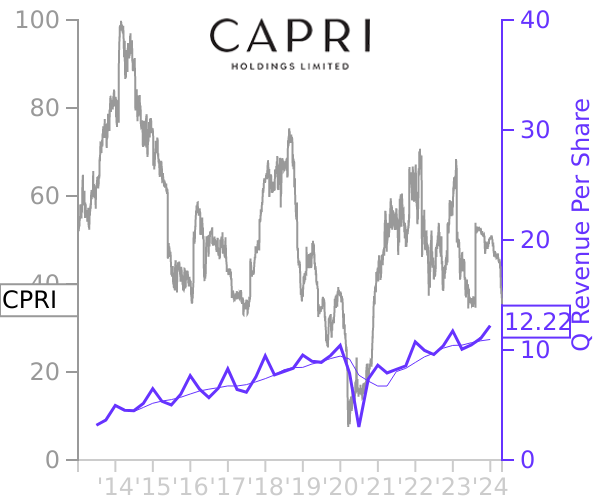
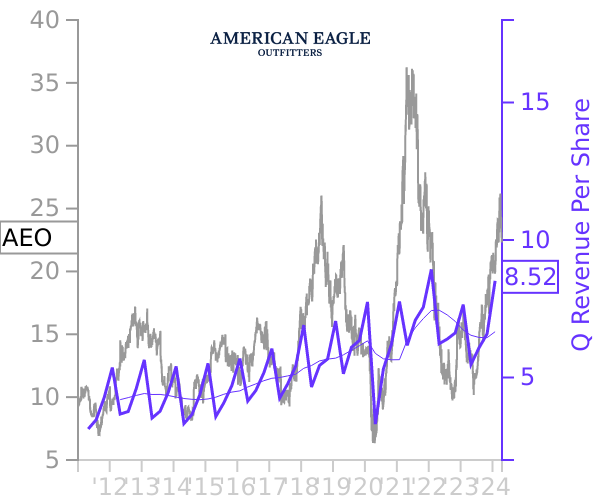
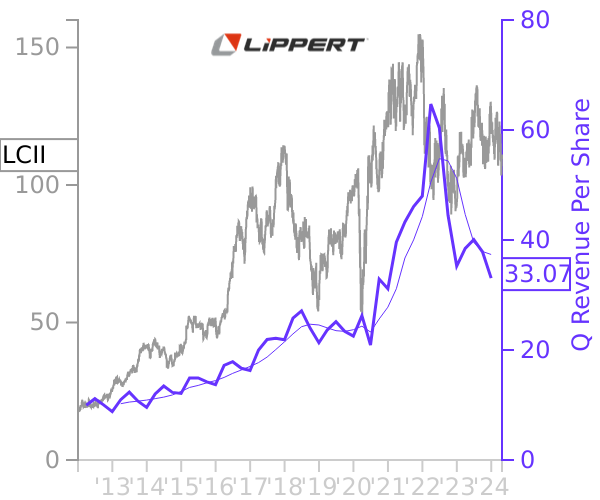
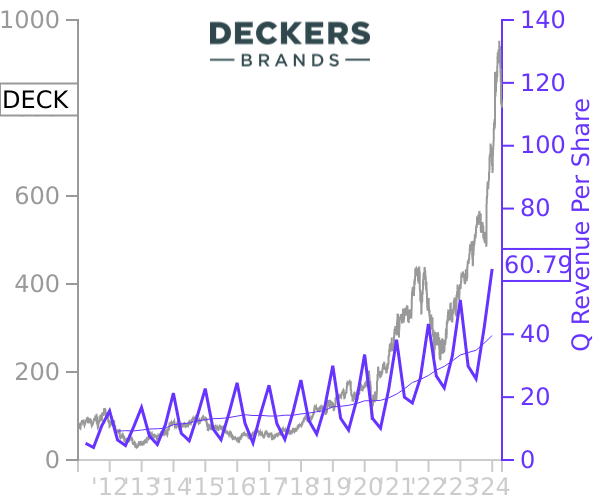
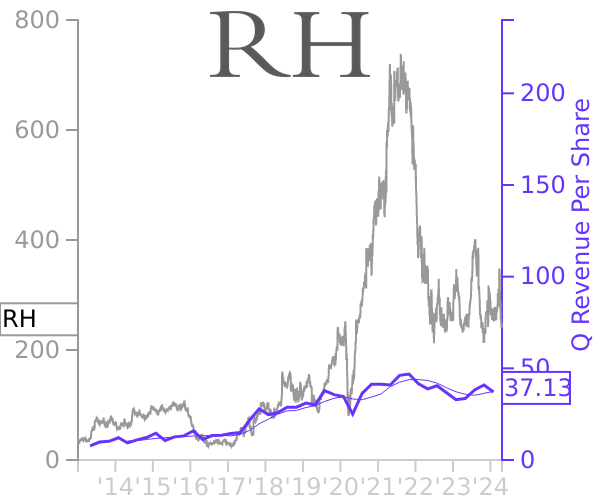
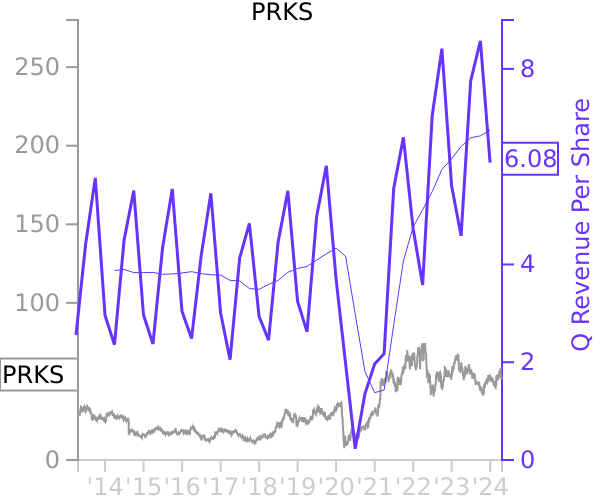
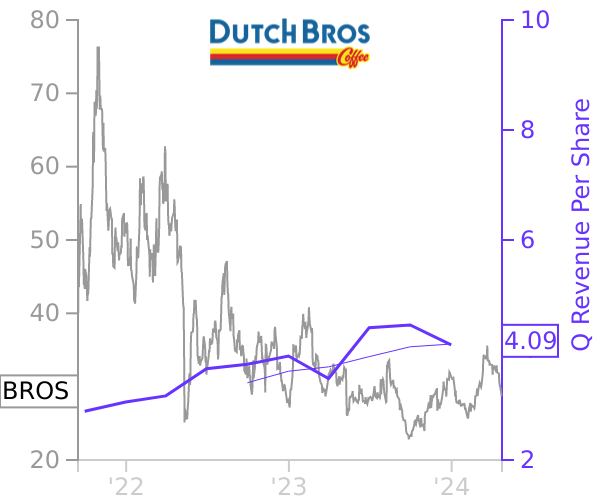
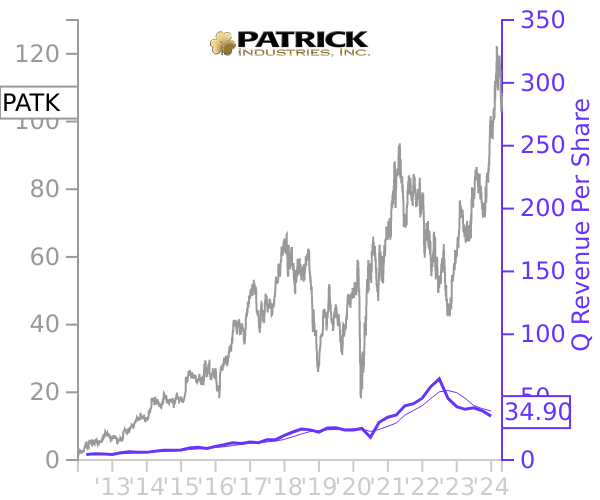
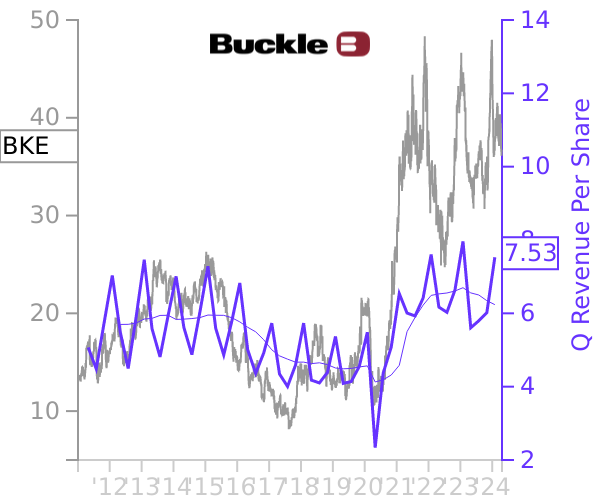
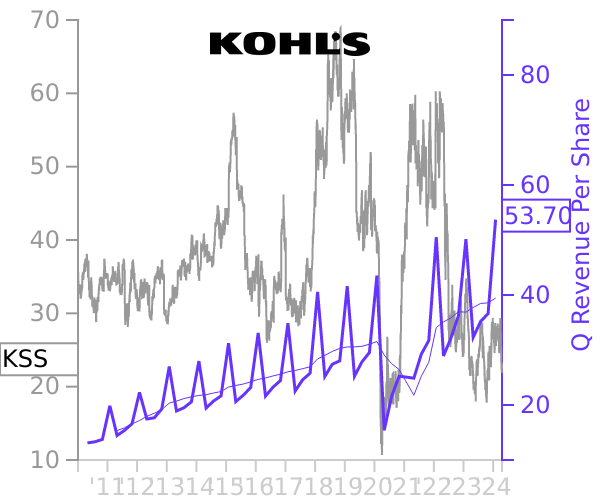
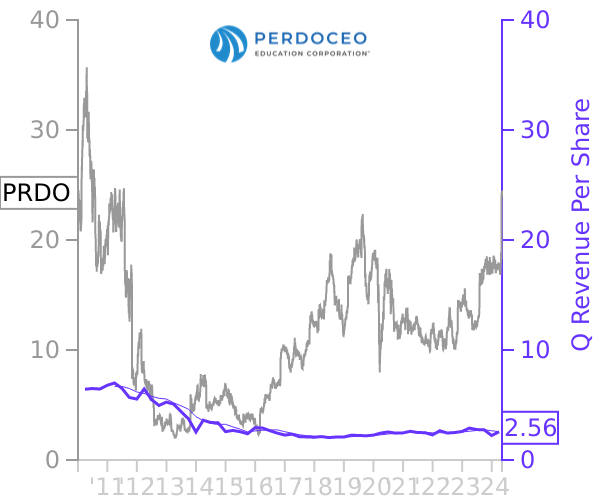
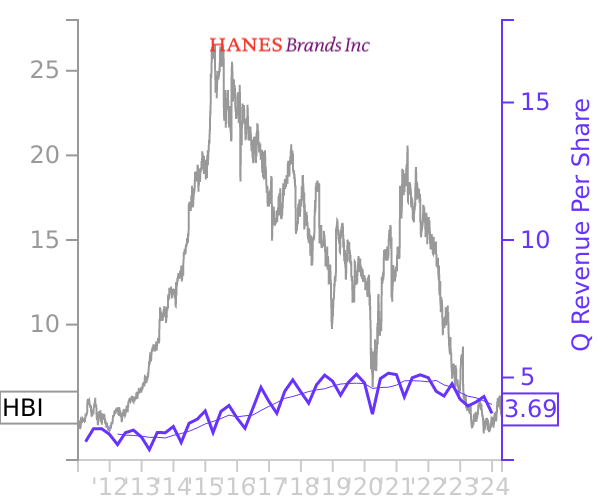
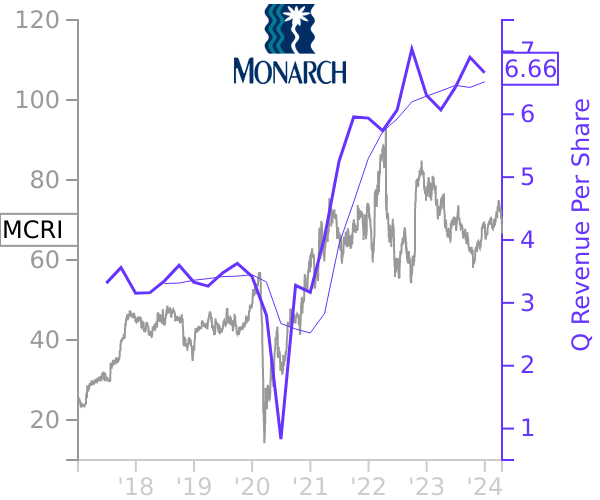
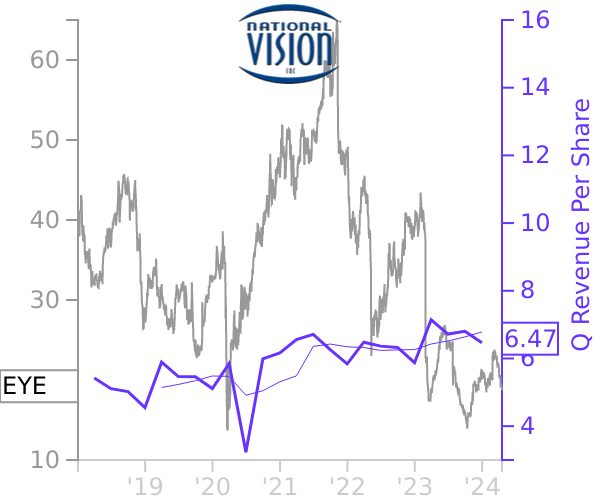
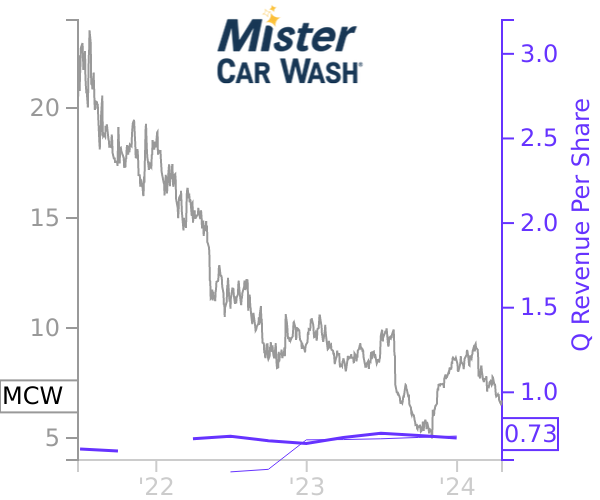
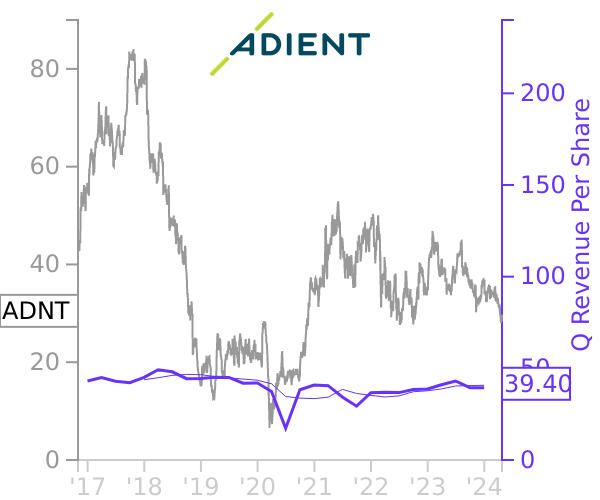
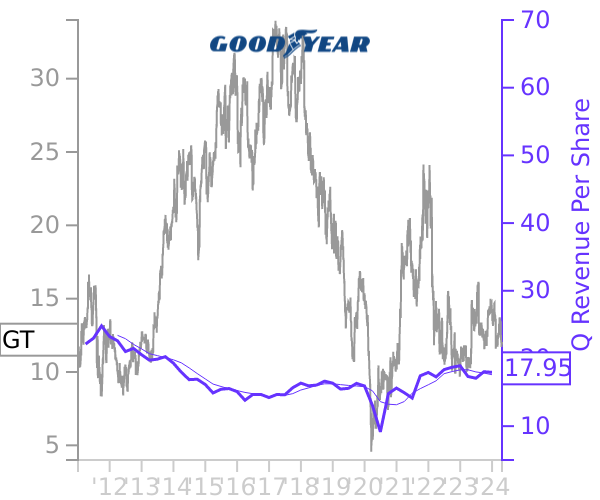
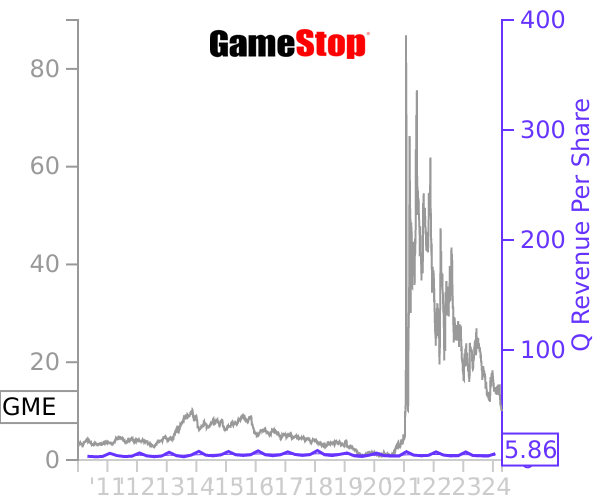
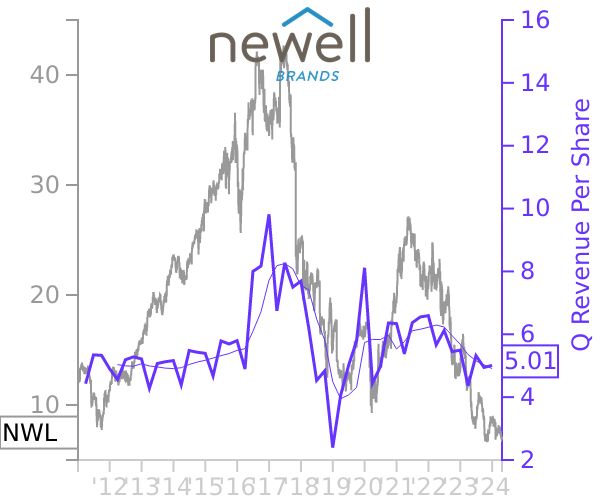
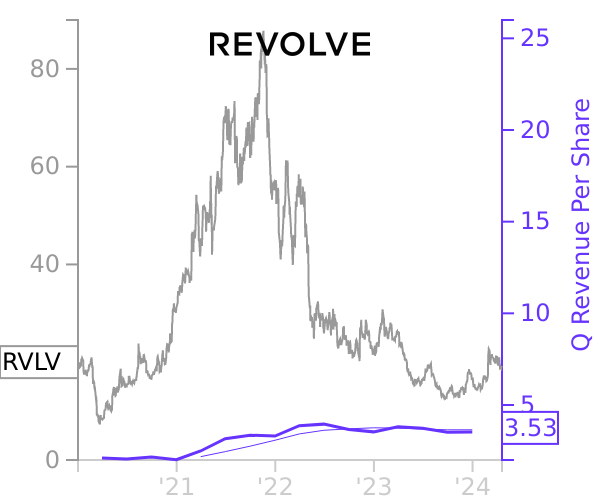
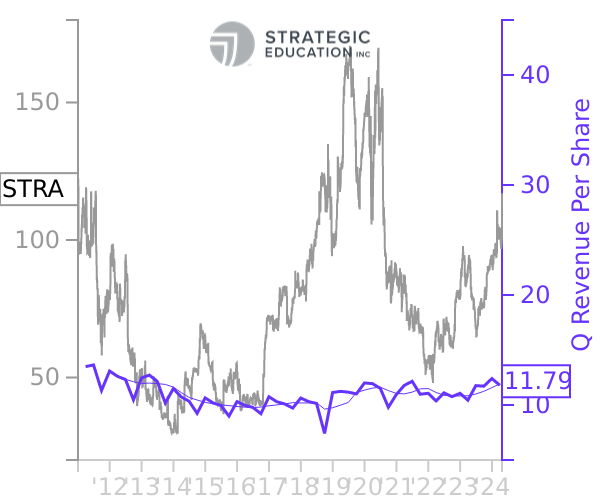
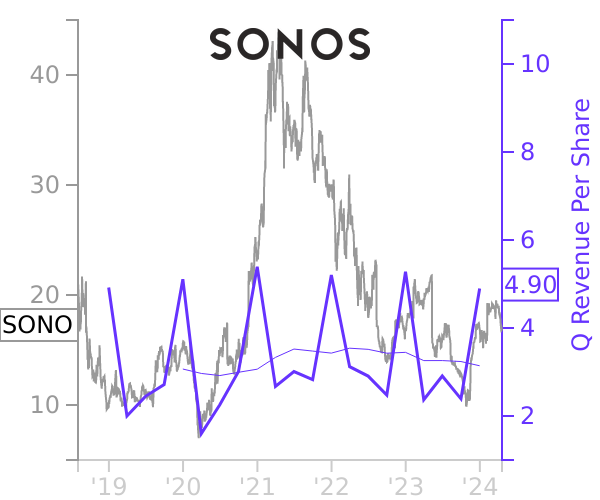
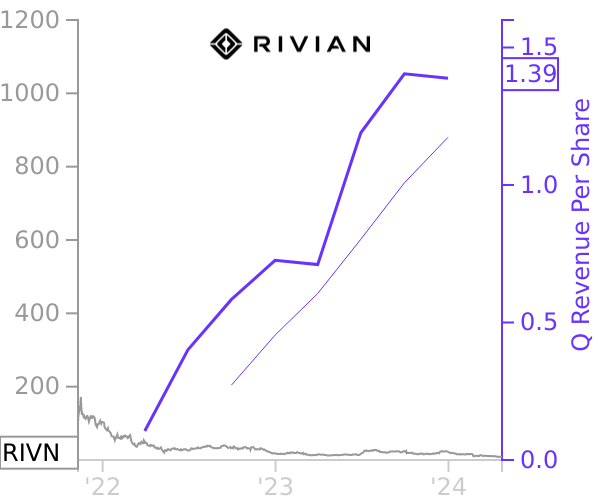
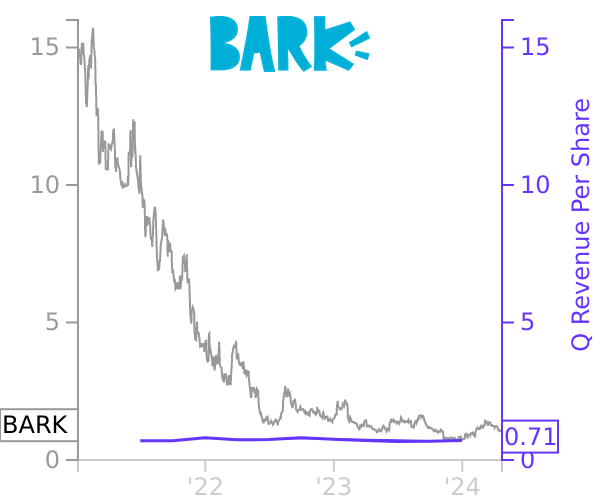
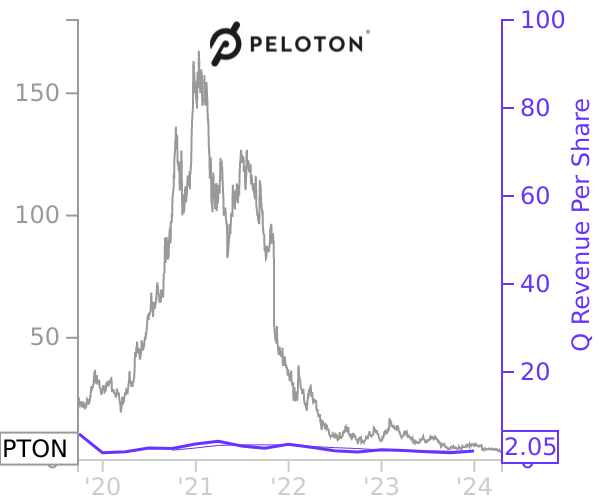
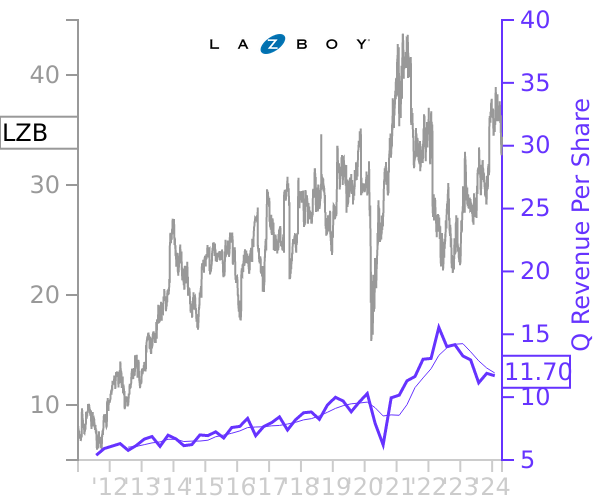
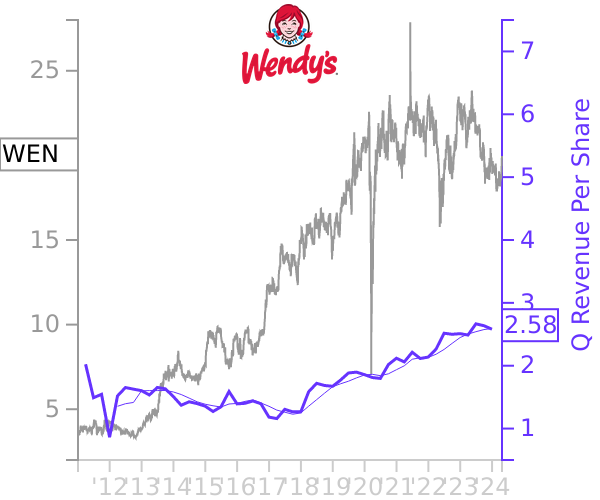
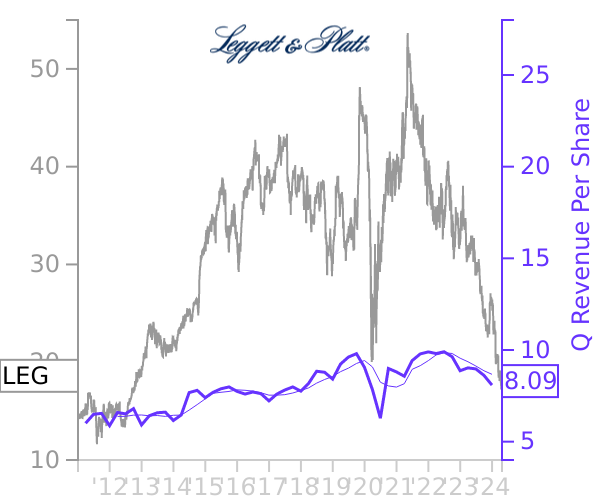
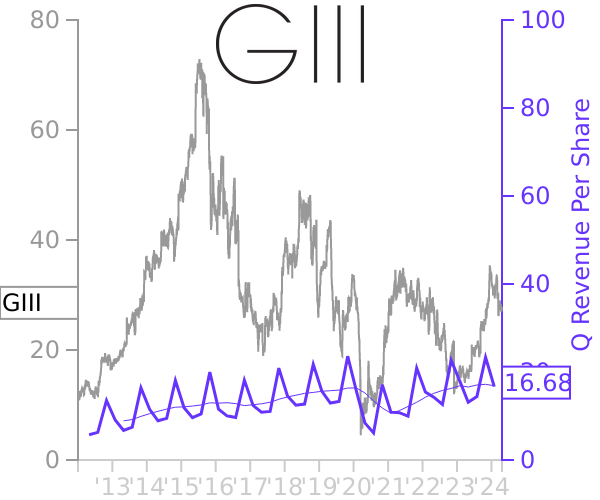
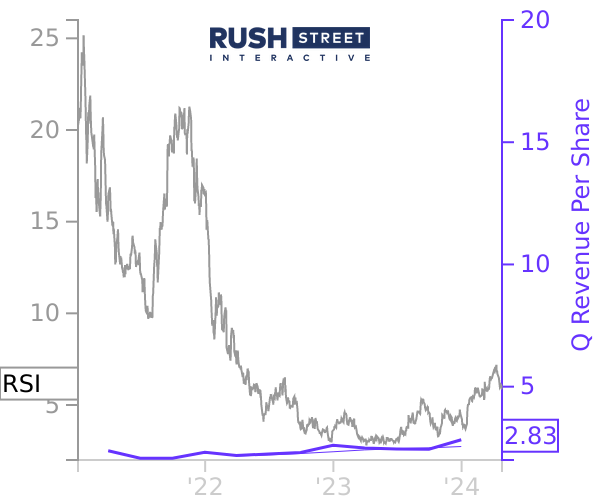
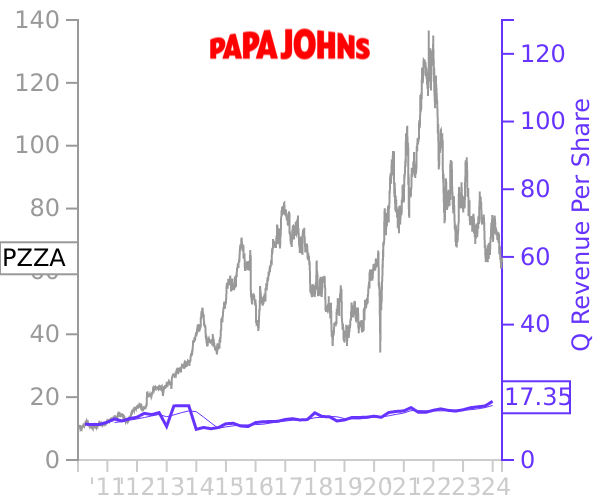
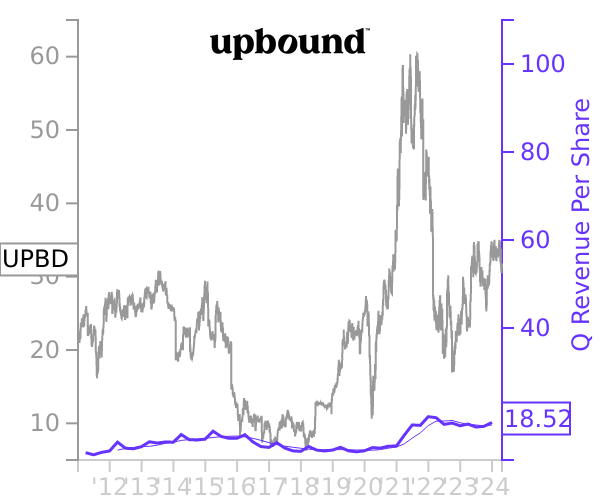
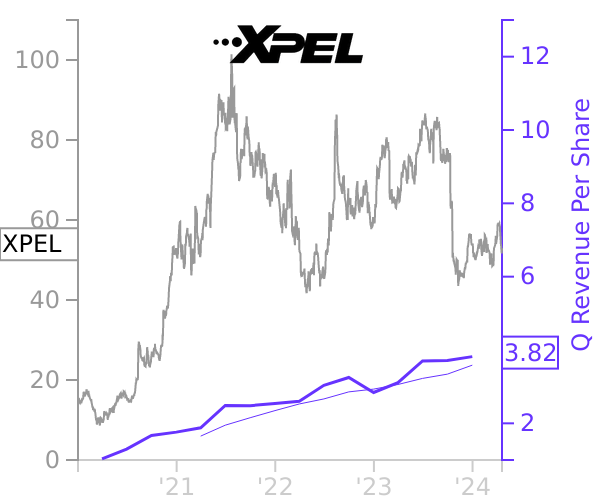
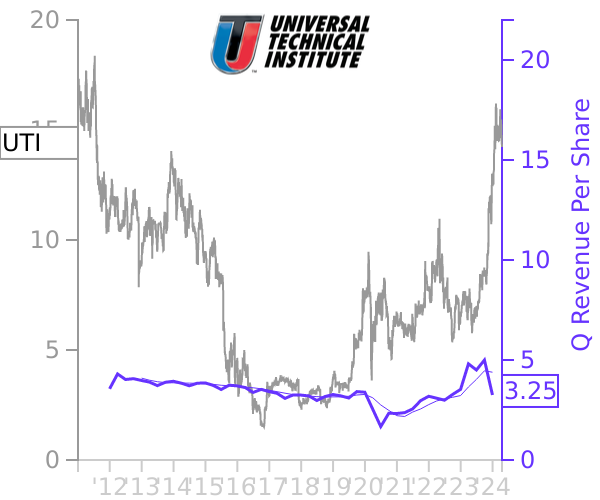
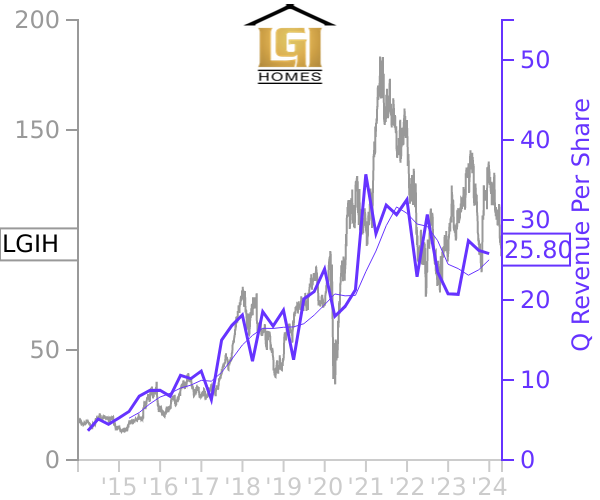
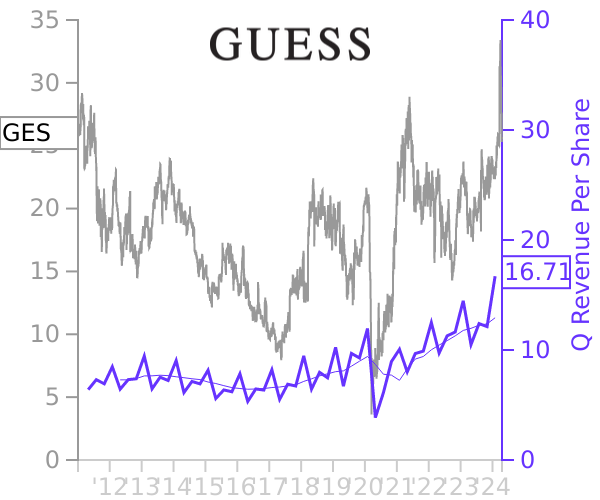
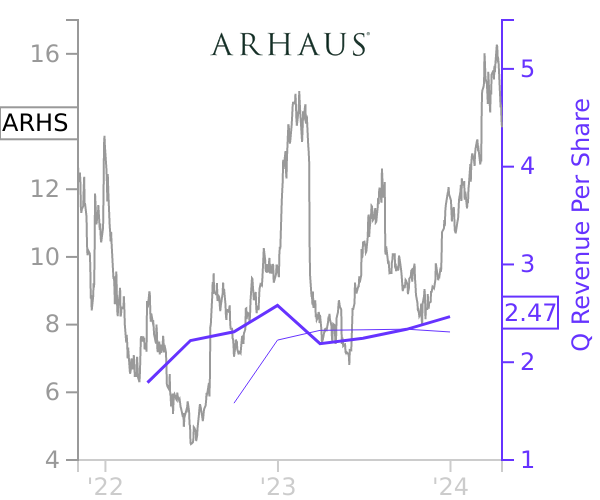
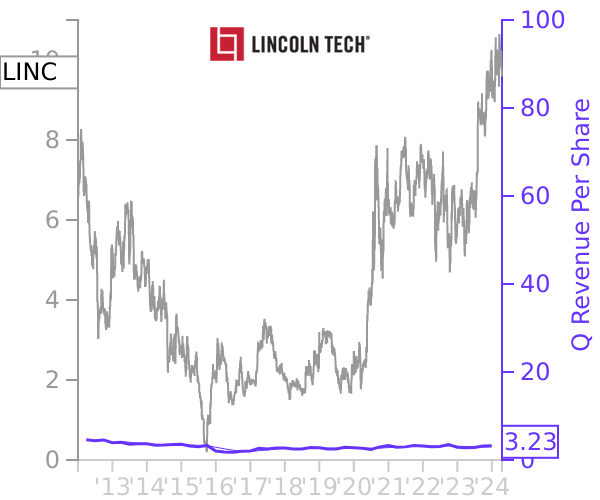
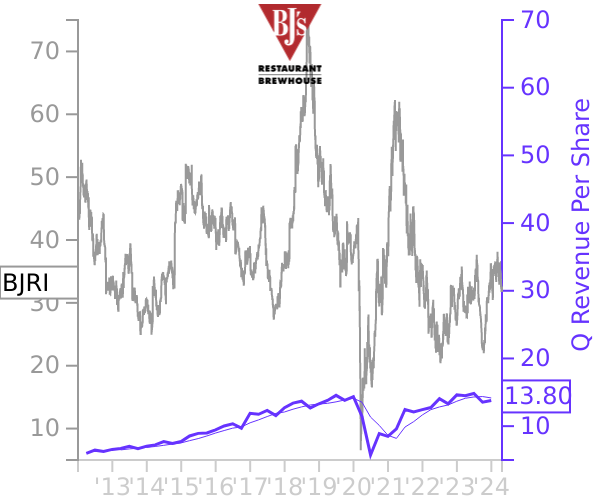
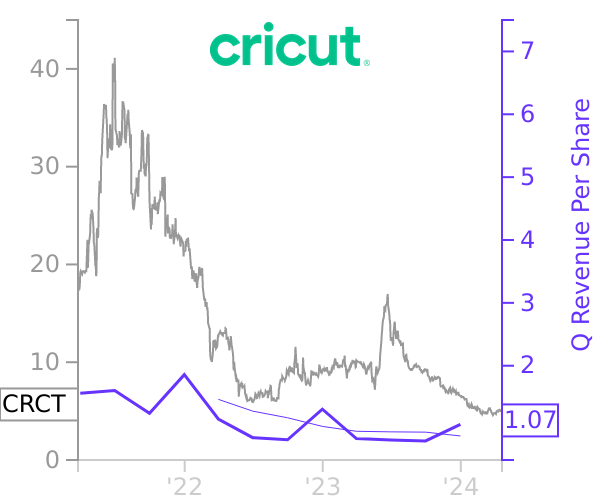
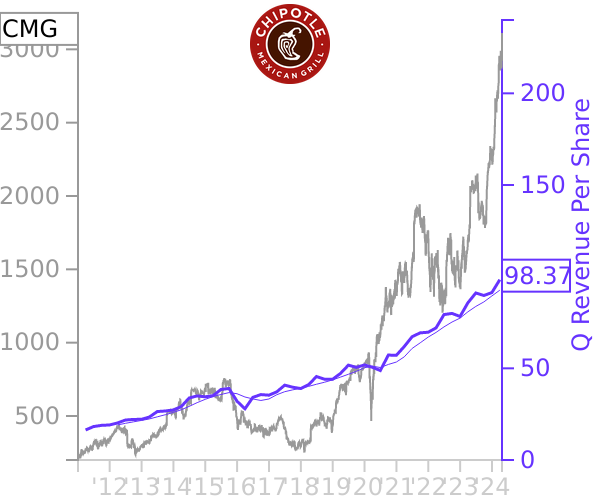
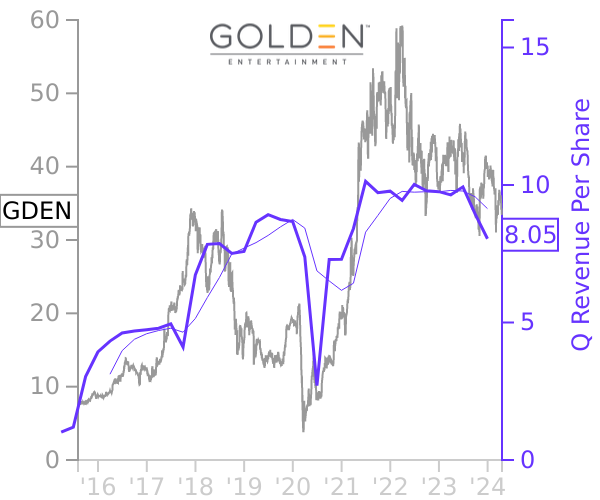
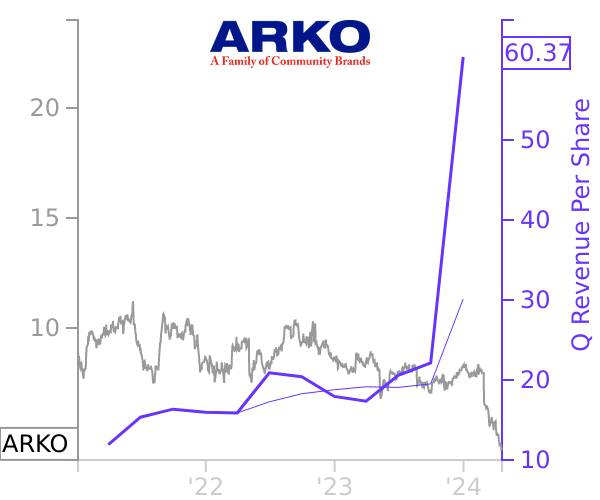
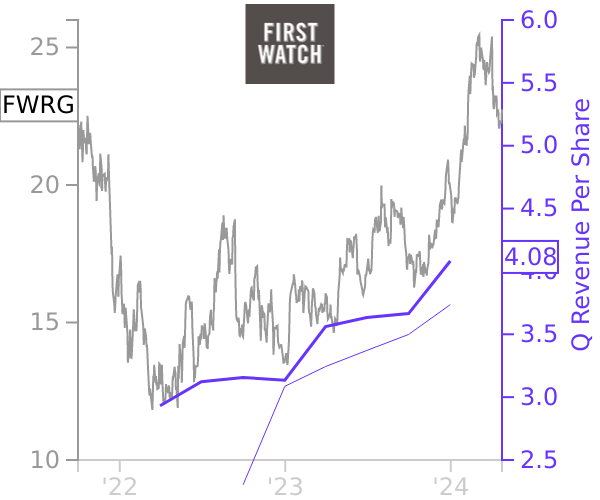
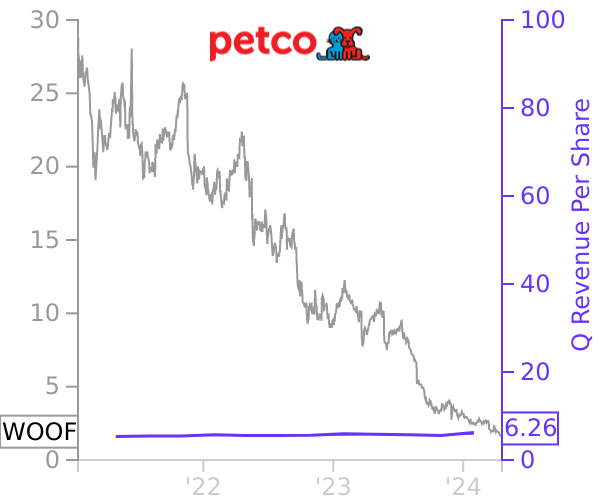
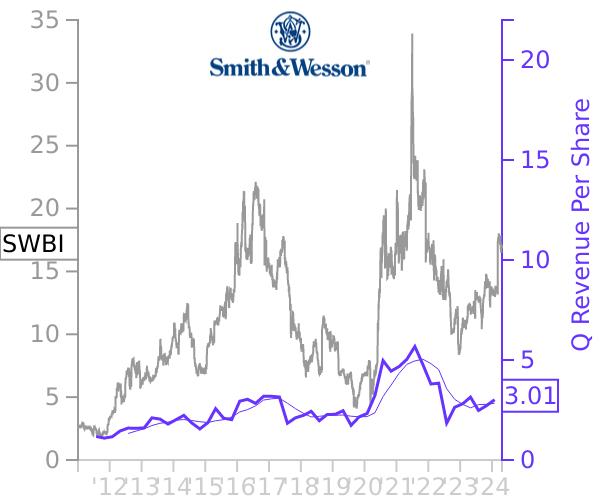
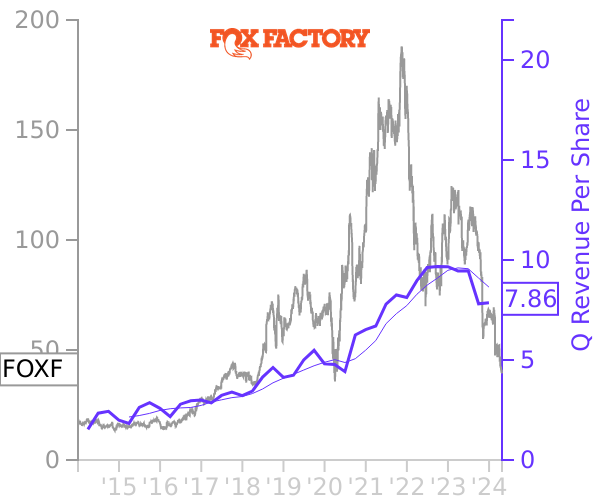
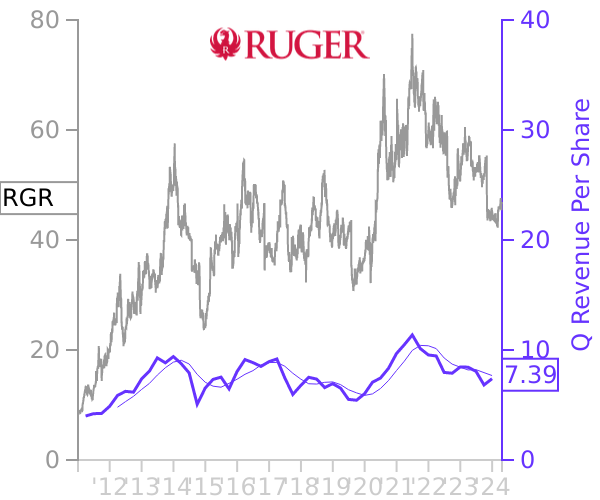
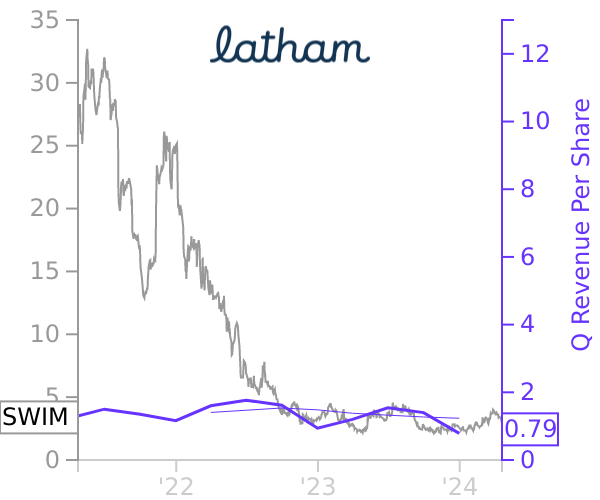
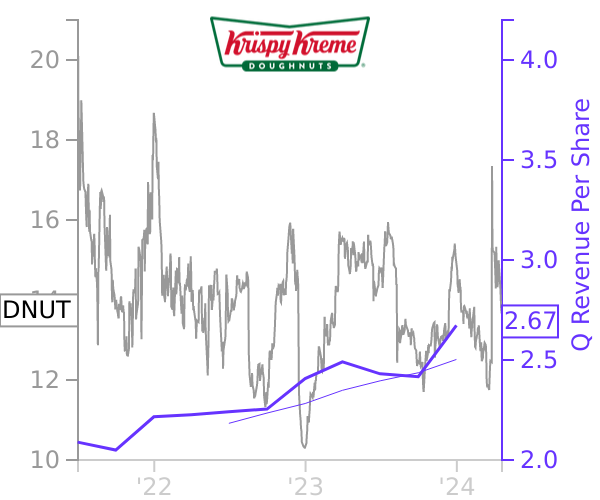
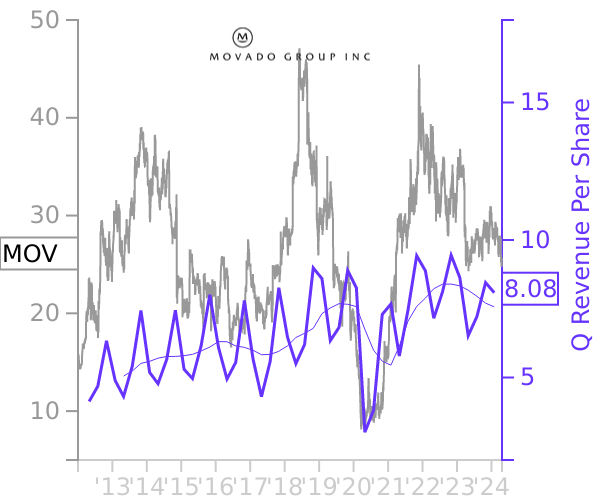
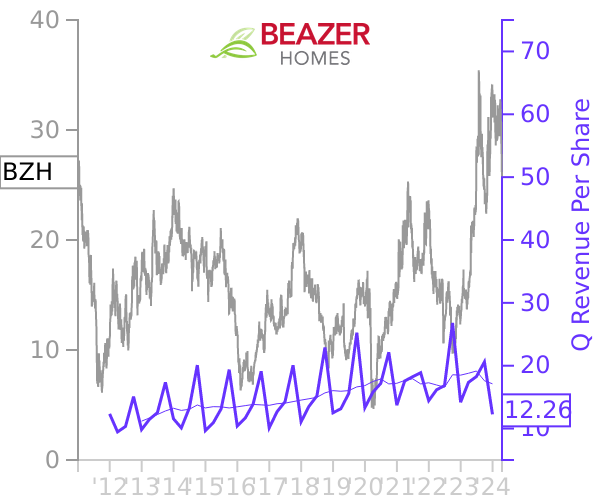
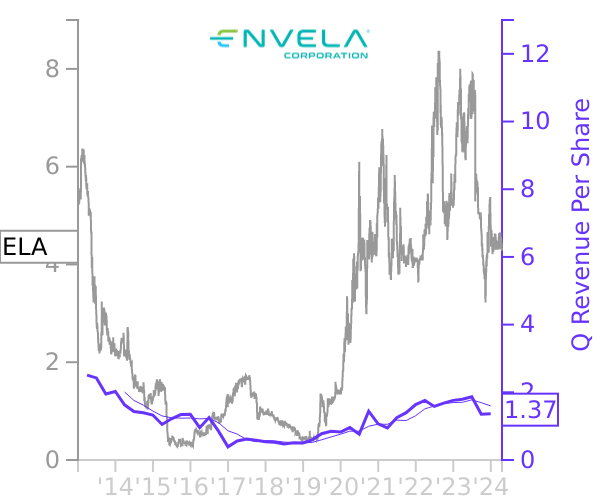
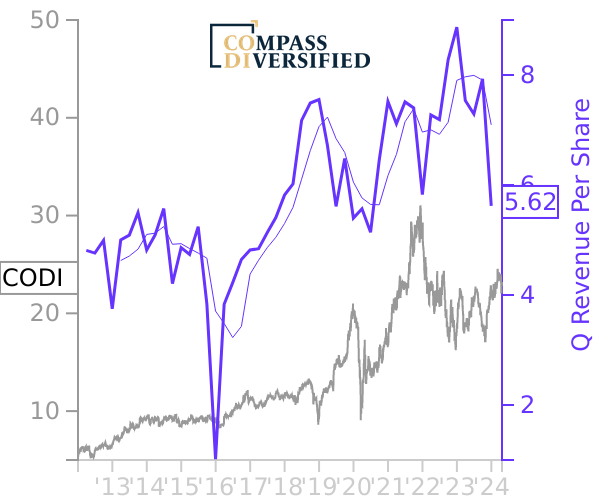
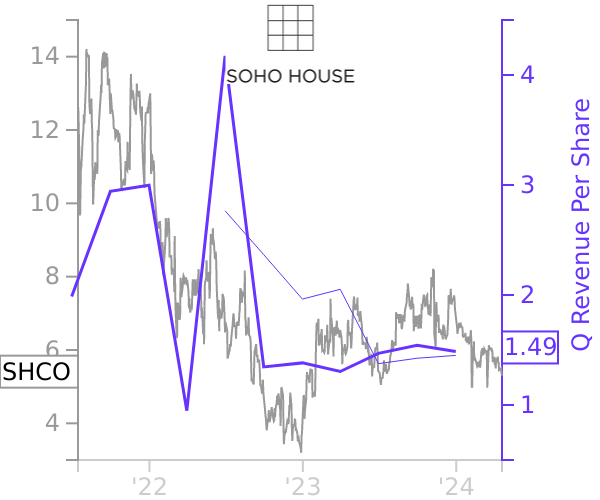
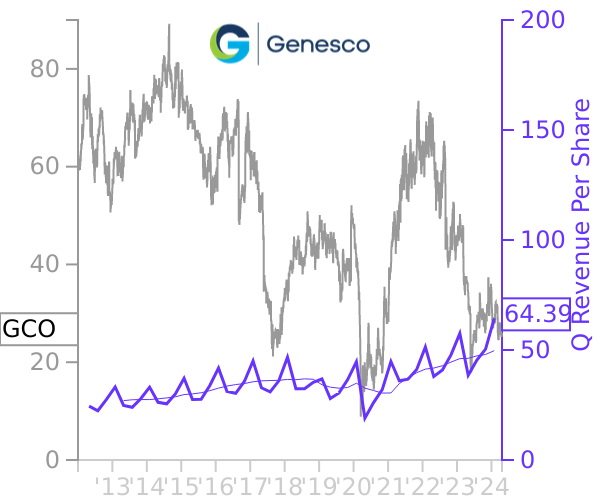
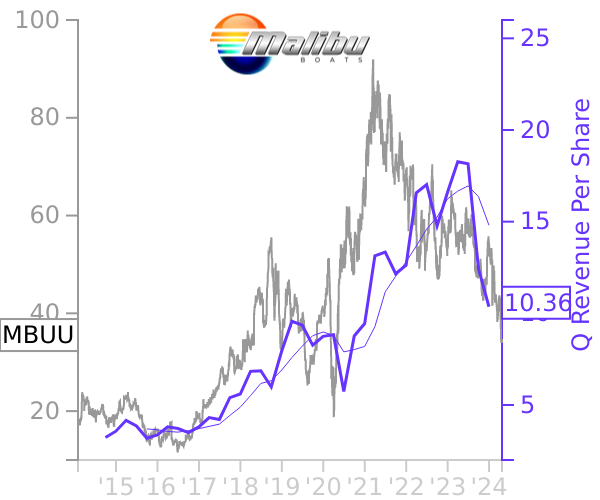
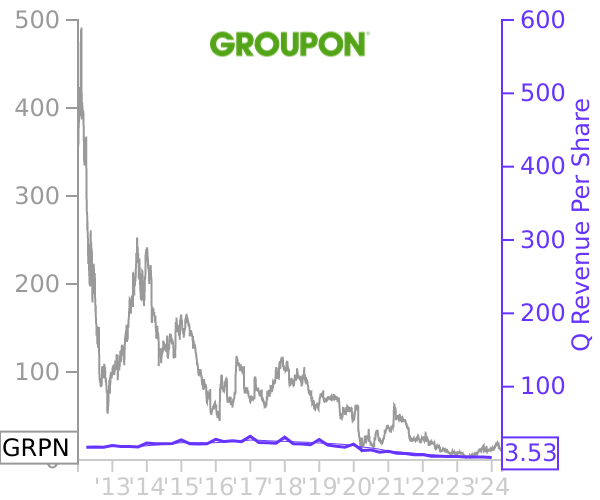
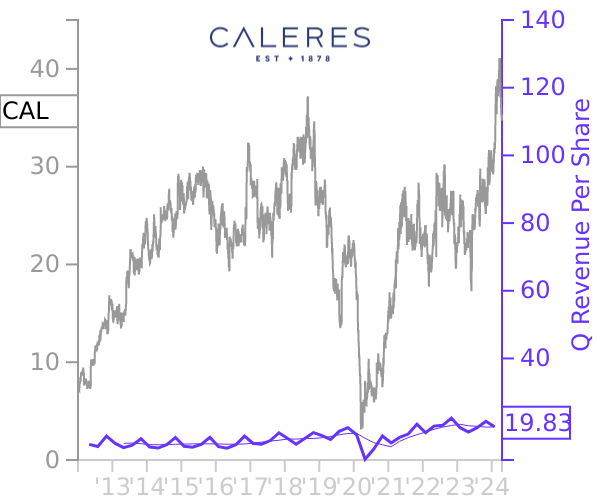
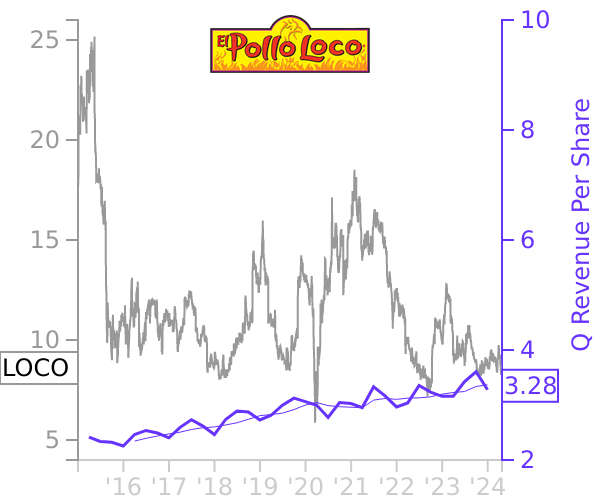
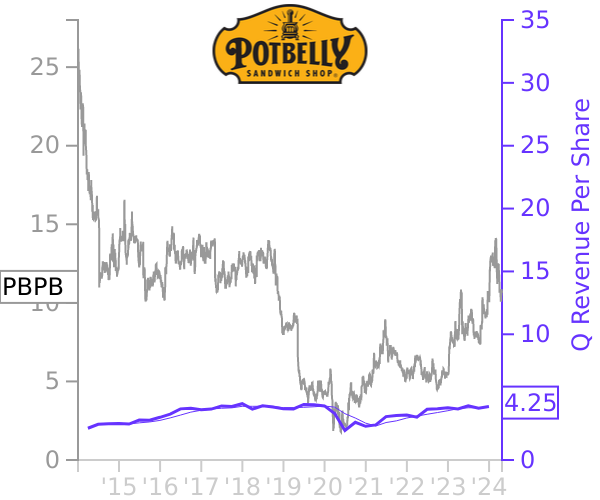
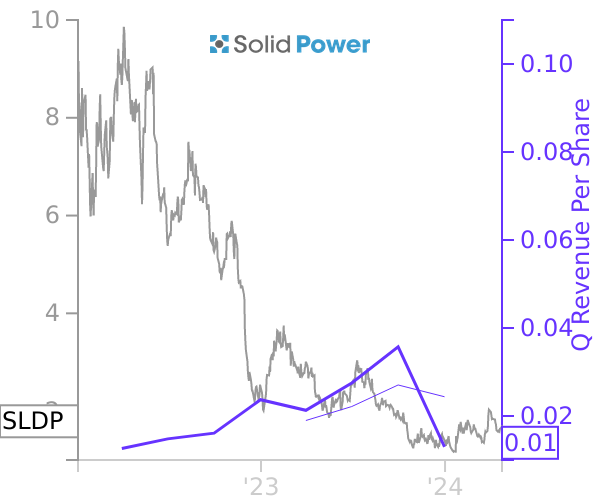
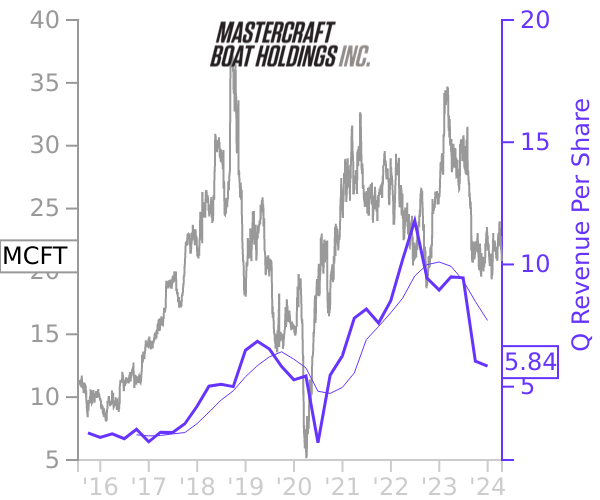
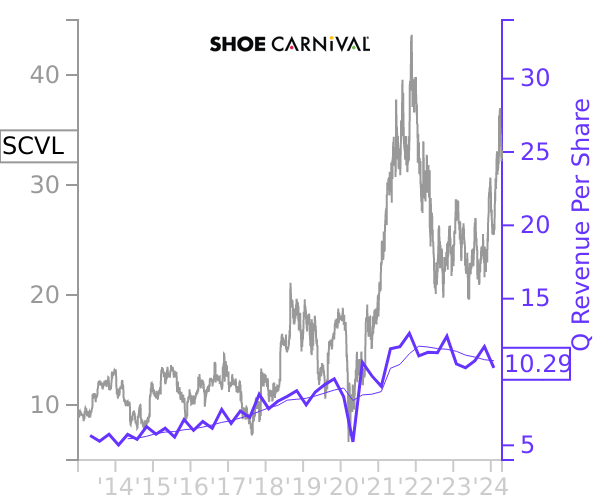
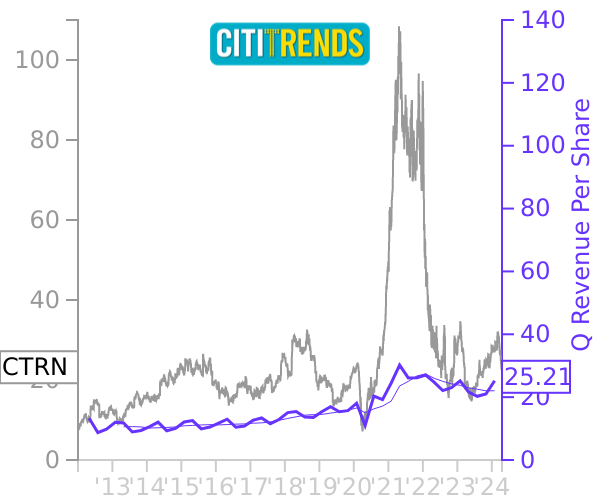
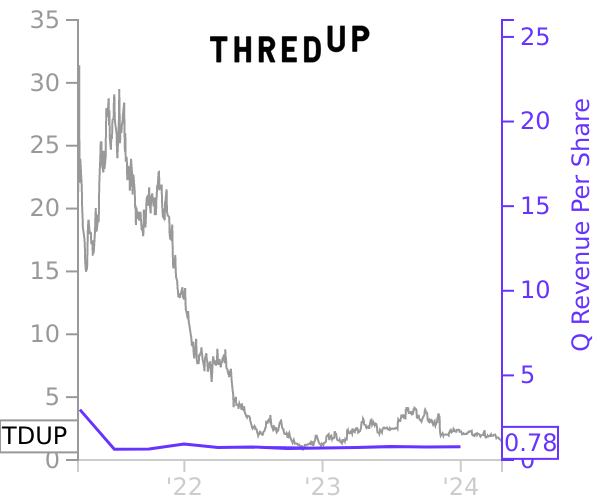
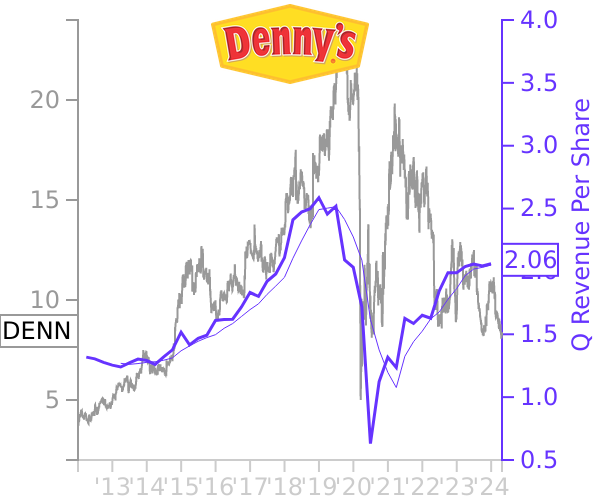
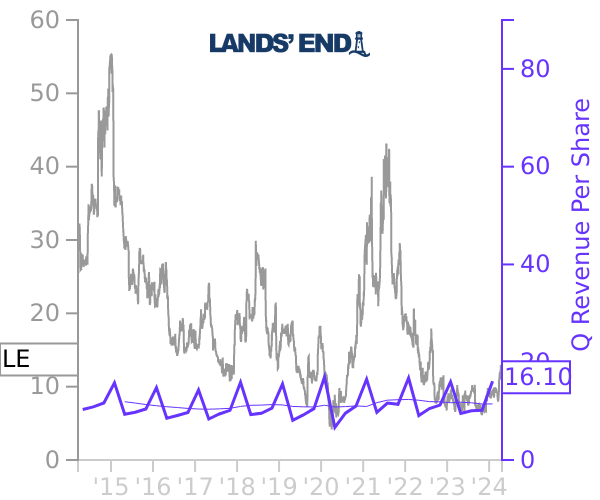
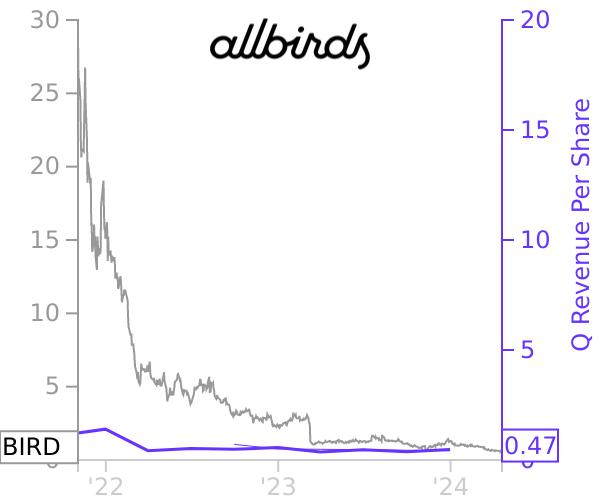
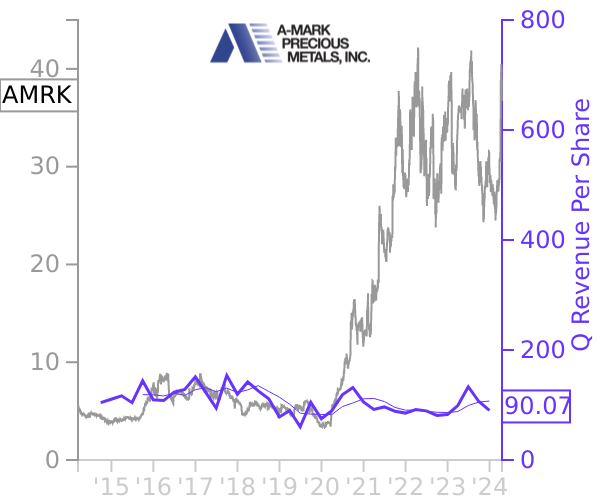
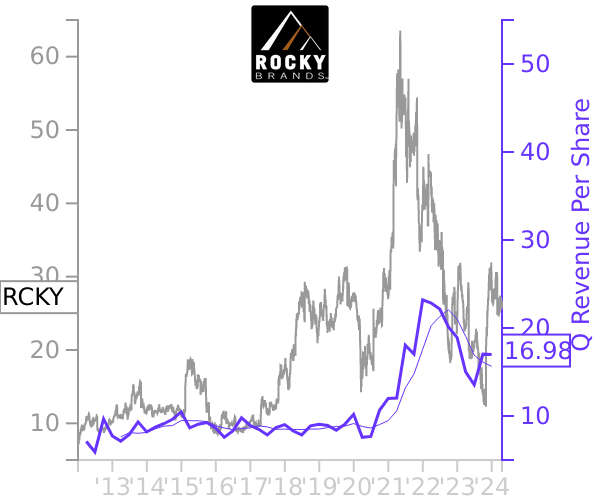
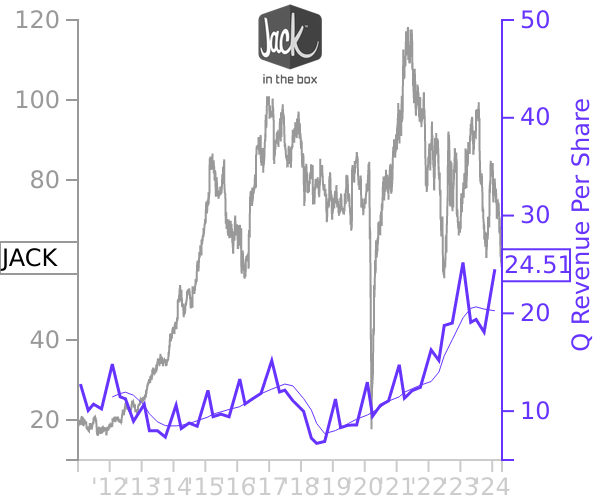
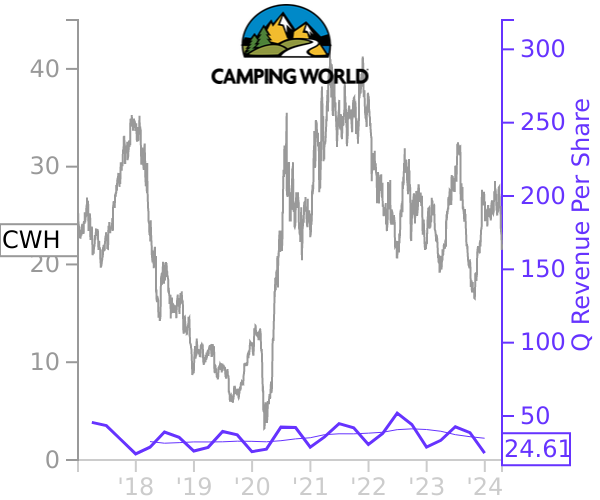
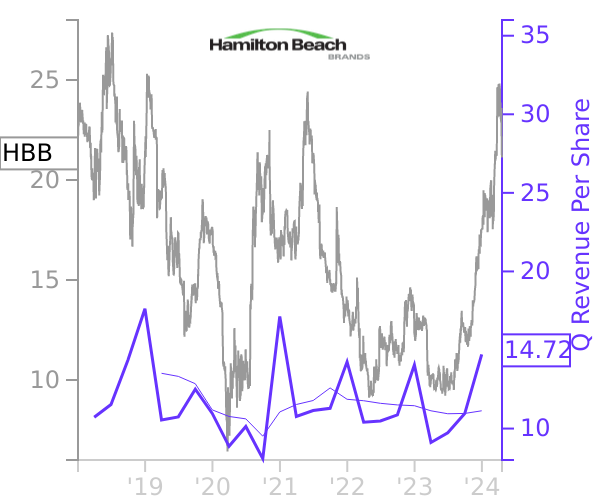
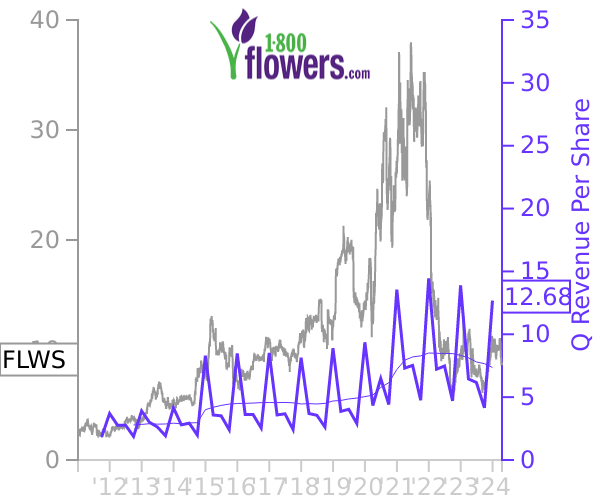
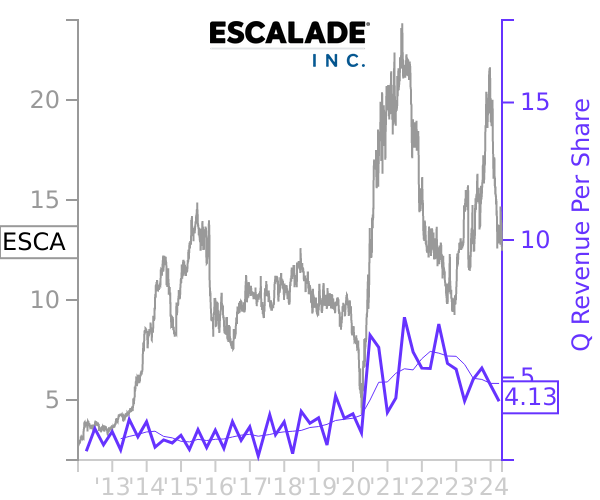
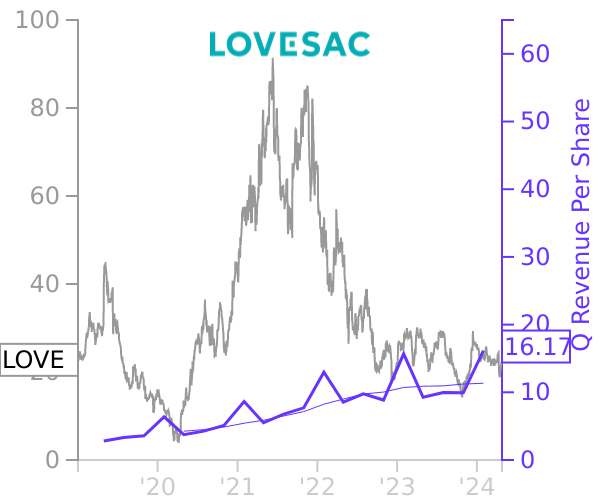
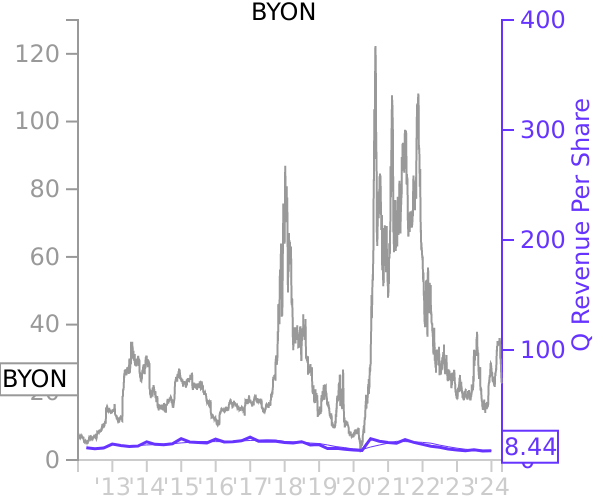
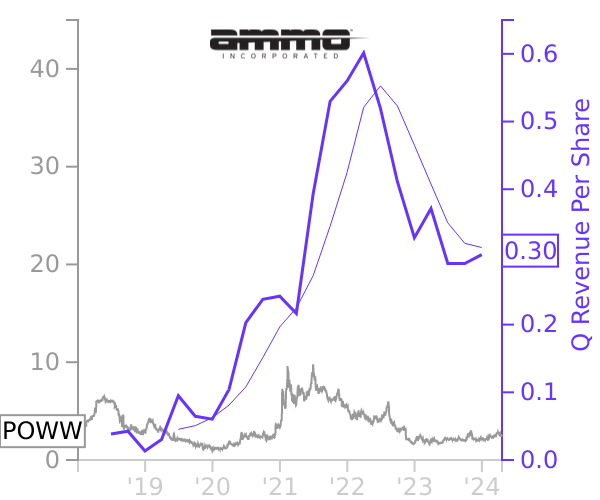
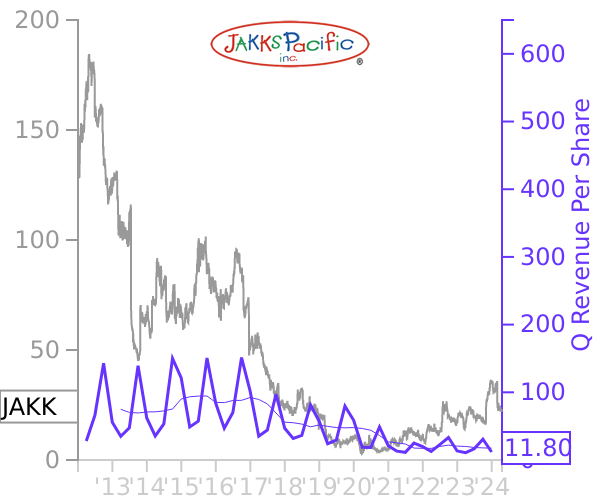
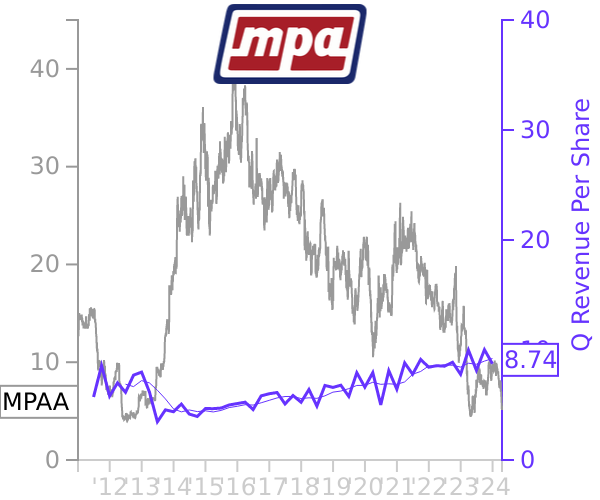
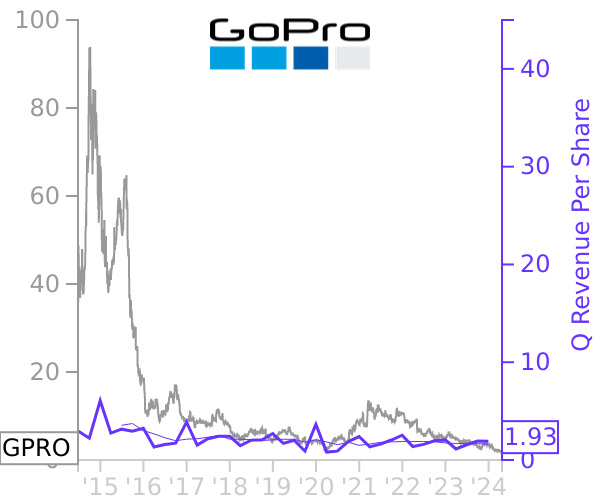
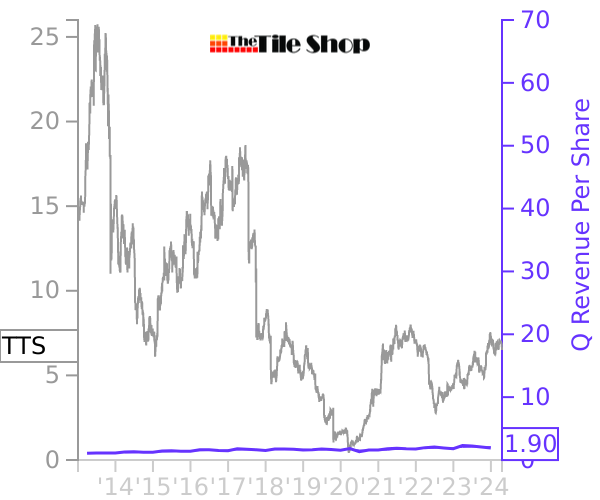
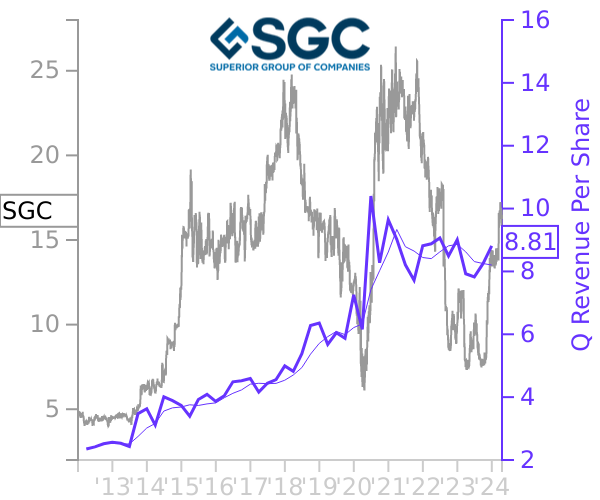
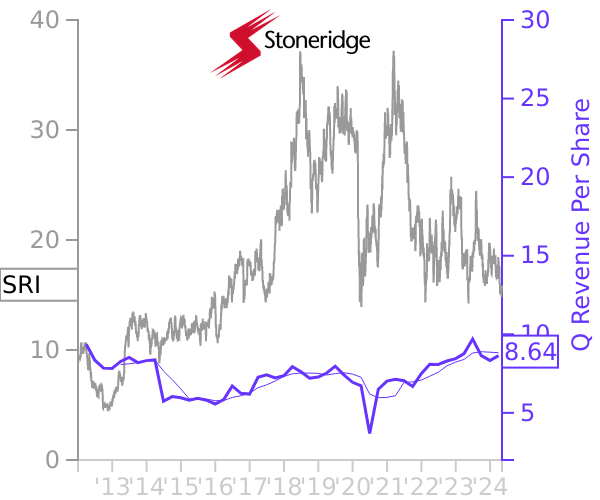
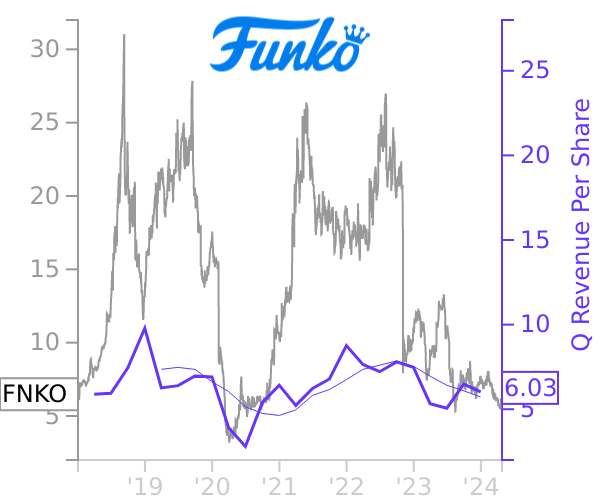
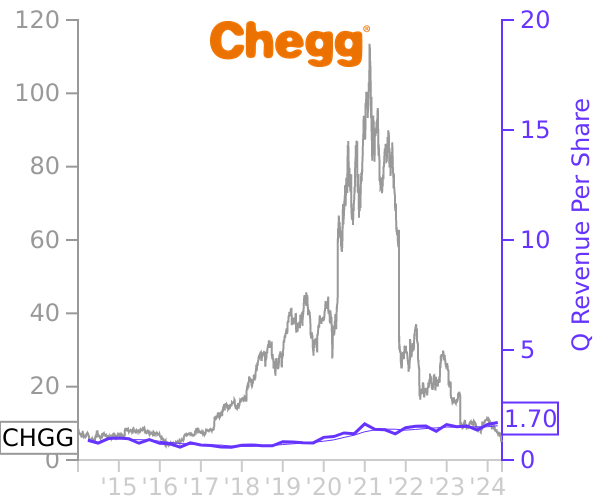
Consumer Discretionary Stock Prices vs Revenue
Quarterly revenue and earnings fluctuate like stock prices. Get the big picture with insights from company insiders and leading investors.
Recent Filings
Largest Companies
Insider Buying
Recent Consumer Discretionary Filings


Largest Market Caps


Software
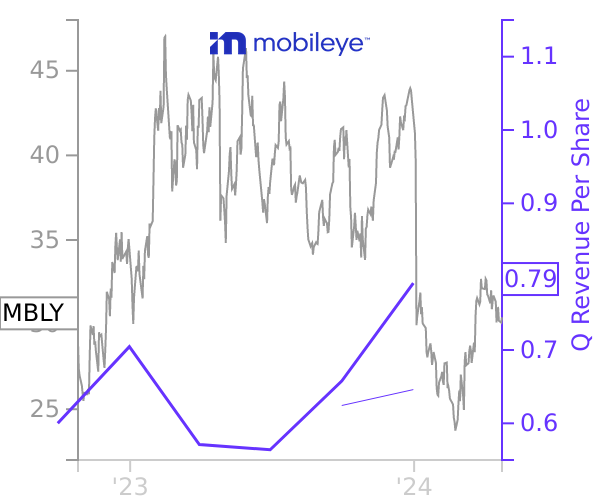
Mobileye Global


Software
Duolingo
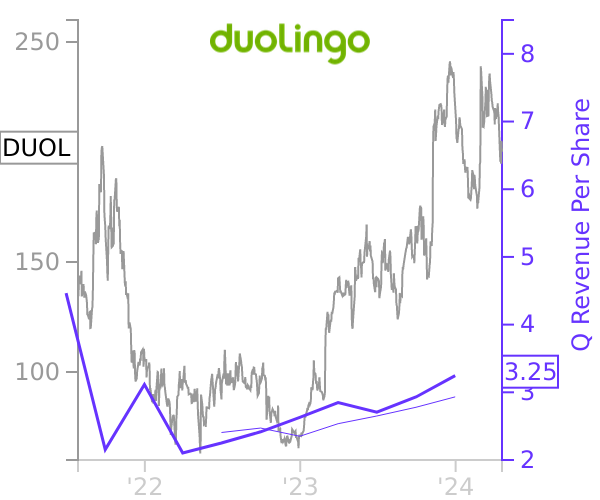


Software
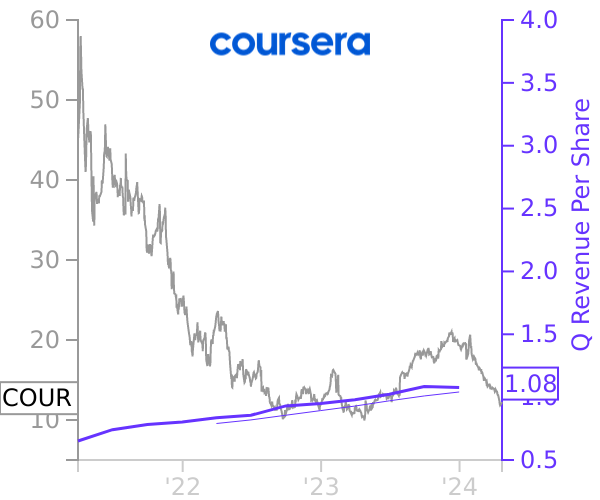
Coursera


Software
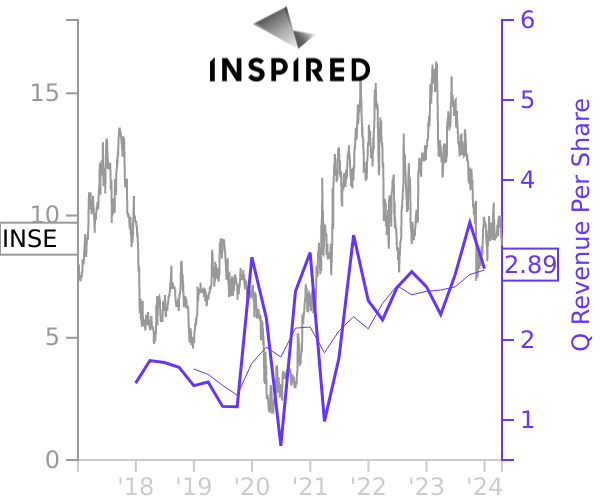
Inspired Entertainment