
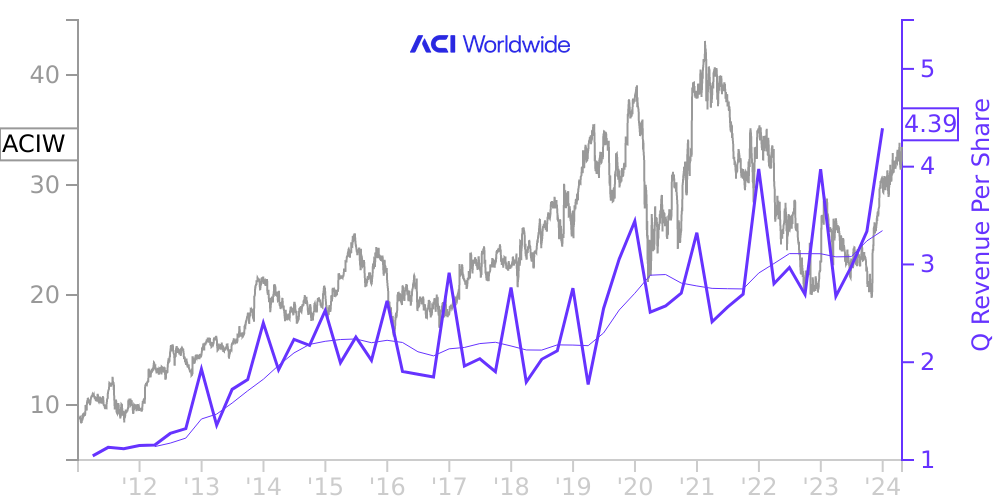
ACIW Stock Price Correlated With ACI Worldwide Financials
External Links ⌄
Income Statement
Cash Flow
Balance Sheet
ACIW Income Statement
Enable JavaScript and reload
Revenue, Net:
Cost of Goods & Services Sold:
Gross Profit:
Selling, General & Admin Expense:
Research & Development Expense:
Total Operating Expenses:
Operating Income:
Income Taxes:
Net Income:
ACIW Cash Flow
Enable JavaScript and reload
Operating Activities Net Income:
Depreciation, Depletion & Amortization:
Change in Accounts Receiveable:
Net Cash from Operations:
Repurchases/Buybacks Common Stock:
Issuance of Long-term Debt:
Cash Dividends Paid:
Net Cash from Financing Activities:
Property, Plant & Equipment Purchases:
Purchases of Businesses, Net of Cash:
Net Cash from Investing Activities:
Net Change in Cash & Equivalents:
ACIW Balance Sheet
Enable JavaScript and reload
Cash and Cash Equivalents:
Short-Term Investments:
Accounts Receivable, Net:
Inventories:
Total Current Assets:
Property, Plant & Equipment, Net:
Total Assets:
Accounts Payable:
Current Portion of Long-Term Debt:
Total Short-Term Liabilities:
Long Term Debt, Non-Current Portion:
Total Long-Term Liabilities:
Total Liabilities:
COMPANY PROFILE
Condensed Consolidated Financial Statements The unaudited condensed consolidated financial statements include the accounts of ACI Worldwide, Inc. and its wholly-owned subsidiaries (collectively, the “Company”). All intercompany balances and transactions have been eliminated. The condensed consolidated financial statements as of March 31, 2022, and for the three months ended March 31, 2022 and 2021, are unaudited and reflect all adjustments of a normal recurring nature, which are, in the opinion of management, necessary for a fair presentation, in all material respects, of the financial position and operating results for the interim periods. The condensed consolidated balance sheet as of December 31, 2021, is derived from the audited financial statements.
The condensed consolidated financial statements contained herein should be read in conjunction with the consolidated financial statements and notes thereto contained in the Company’s annual report on Form 10-K for the fiscal year ended December 31, 2021, filed on February 24, 2022. Results for the three months ended March 31, 2022, are not necessarily indicative of results that may be attained in the future.
The preparation of condensed consolidated financial statements in conformity with accounting principles generally accepted in the United States (“U.S. GAAP”) requires management to make judgments, estimates, and assumptions that affect the reported amounts of assets and liabilities and disclosure of contingent assets and liabilities at the date of the condensed consolidated financial statements and the reported amounts of revenues and expenses during the reporting period. These estimates and assumptions are affected by management’s application of accounting policies, as well as uncertainty in the current economic environment due to COVID-19. Actual results could differ from those estimates.
Revision of Prior Period Financial Statements
As of December 31, 2021, the Company revised the previously reported consolidated statements of cash flows to include settlement deposits in total cash and cash equivalents and settlement receivables and settlement liabilities net activity in cash flows from financing activities, both of which were previously included in cash flows from operating activities. This immaterial revision did not have an effect on its previously reported consolidated balance sheets, statements of operations, statements of comprehensive income, or statements of stockholders' equity.
A summary of the revisions to the previously reported balances are presented in the table below for comparative purposes (in thousands):
Three Months Ended March 31, 2021 As reported Revision adjustment As revised Cash flows from operating activities: Other current and noncurrent assets and liabilities $ (34,315) $ (366) $ (34,681) Net cash flows from operating activities 70,123 (366) 69,757 Cash flows from financing activities: Net decrease in settlement assets and liabilities $ — $ (71,264) $ (71,264) Net cash flows from financing activities (38,693) (71,264) (109,957) Net increase (decrease) in cash and cash equivalents $ 18,990 $ (71,630) $ (52,640) Cash and cash equivalents, including settlement deposits, beginning of period 165,374 100,008 265,382 Cash and cash equivalents, including settlement deposits, end of period 184,364 28,378 212,742
Other Current Liabilities
The components of other current liabilities are included in the following table (in thousands): March 31, 2022 December 31, 2021 Operating lease liabilities $ 12,226 $ 11,518 Vendor financed licenses 9,729 12,521 Accrued interest 3,020 8,776 Royalties payable 2,331 4,102 Other 40,617 42,677 Total other current liabilities $ 67,923 $ 79,594
Settlement Assets and Liabilities
Individuals and businesses settle their obligations to the Company’s various Biller clients using credit or debit cards or via automated clearing house (“ACH”) payments. The Company creates a receivable for the amount due from the credit or
Free historical financial statements for ACI Worldwide Inc.. See how revenue, income, cash flow, and balance sheet financials have changed over 61 quarters since 2011. Compare with ACIW stock chart to see long term trends.
Data imported from ACI Worldwide Inc. SEC filings. Check original filings before making any investment decision.