Technology › Special Industry Machinery, Nec

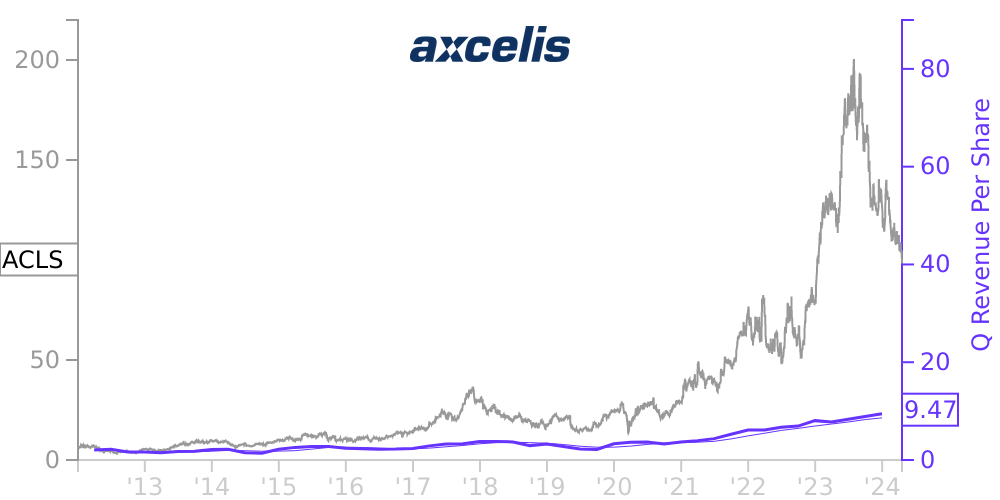
ACLS Stock Price Correlated With Axcelis Technologies Financials
External Links ⌄
Income Statement
Cash Flow
Balance Sheet
ACLS Income Statement
Enable JavaScript and reload
Revenue, Net:
Cost of Goods & Services Sold:
Gross Profit:
Selling, General & Admin Expense:
Research & Development Expense:
Total Operating Expenses:
Operating Income:
Income Taxes:
Net Income:
ACLS Cash Flow
Enable JavaScript and reload
Operating Activities Net Income:
Depreciation, Depletion & Amortization:
Change in Accounts Receiveable:
Net Cash from Operations:
Repurchases/Buybacks Common Stock:
Issuance of Long-term Debt:
Cash Dividends Paid:
Net Cash from Financing Activities:
Property, Plant & Equipment Purchases:
Purchases of Businesses, Net of Cash:
Net Cash from Investing Activities:
Net Change in Cash & Equivalents:
ACLS Balance Sheet
Enable JavaScript and reload
Cash and Cash Equivalents:
Short-Term Investments:
Accounts Receivable, Net:
Inventories:
Total Current Assets:
Property, Plant & Equipment, Net:
Total Assets:
Accounts Payable:
Current Portion of Long-Term Debt:
Total Short-Term Liabilities:
Long Term Debt, Non-Current Portion:
Total Long-Term Liabilities:
Total Liabilities:
COMPANY PROFILE
Note 1. Nature of Business Axcelis Technologies, Inc. (“Axcelis” or the “Company”) was incorporated in Delaware in 1995, and is a worldwide producer of ion implantation and other processing equipment used in the fabrication of semiconductor chips in the United States, Europe and Asia. In addition, we provide extensive aftermarket service and support, including spare parts, equipment upgrades, used equipment and maintenance services to the semiconductor industry.
Free historical financial statements for Axcelis Technologies Inc. See how revenue, income, cash flow, and balance sheet financials have changed over 57 quarters since 2012. Compare with ACLS stock chart to see long term trends.
Data imported from Axcelis Technologies Inc SEC filings. Check original filings before making any investment decision.