Industrials › Services-Engineering Services

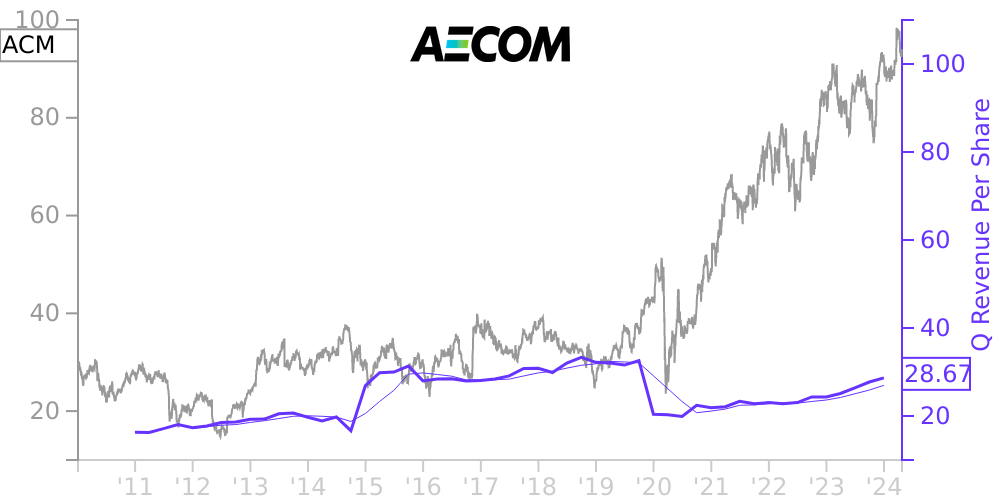
ACM Stock Price Correlated With Aecom Financials
External Links ⌄
Income Statement
Cash Flow
Balance Sheet
ACM Income Statement
Enable JavaScript and reload
Revenue, Net:
Cost of Goods & Services Sold:
Gross Profit:
Selling, General & Admin Expense:
Research & Development Expense:
Total Operating Expenses:
Operating Income:
Income Taxes:
Net Income:
ACM Cash Flow
Enable JavaScript and reload
Operating Activities Net Income:
Depreciation, Depletion & Amortization:
Change in Accounts Receiveable:
Net Cash from Operations:
Repurchases/Buybacks Common Stock:
Issuance of Long-term Debt:
Cash Dividends Paid:
Net Cash from Financing Activities:
Property, Plant & Equipment Purchases:
Purchases of Businesses, Net of Cash:
Net Cash from Investing Activities:
Net Change in Cash & Equivalents:
ACM Balance Sheet
Enable JavaScript and reload
Cash and Cash Equivalents:
Short-Term Investments:
Accounts Receivable, Net:
Inventories:
Total Current Assets:
Property, Plant & Equipment, Net:
Total Assets:
Accounts Payable:
Current Portion of Long-Term Debt:
Total Short-Term Liabilities:
Long Term Debt, Non-Current Portion:
Total Long-Term Liabilities:
Total Liabilities:
COMPANY PROFILE
1. Basis of Presentation The accompanying consolidated financial statements of AECOM (the Company) are unaudited and, in the opinion of management, include all adjustments, including all normal recurring items necessary for a fair statement of the Company’s financial position and results of operations for the periods presented. All intercompany balances and transactions are eliminated in consolidation. The consolidated financial statements should be read in conjunction with the consolidated financial statements and notes thereto included in the Company’s Form 10-K for the fiscal year ended September 30, 2021 (the Annual Report). The accompanying unaudited consolidated financial statements and related notes have been prepared in accordance with generally accepted accounting principles (GAAP) in the United States (U.S.) for interim financial information and with the instructions to Form 10-Q and Rule 10-01 of Regulation S-X. Accordingly, they do not include all of the information and footnotes required by GAAP for complete financial statements. The consolidated financial statements included in this report have been prepared consistently with the accounting policies described in the Annual Report, except as noted, and should be read together with the Annual Report. Certain reclassifications were made to the prior year to conform to current year presentation. Prior period's disaggregated revenue by geographic region reclassifies the India business to Europe, Middle East and Africa to conform with current operations. The results of operations for the three and six months ended March 31, 2022 are not necessarily indicative of the results to be expected for the fiscal year ending September 30, 2022. As discussed in more detail in Note 3, the Company concluded that its self-perform at-risk construction businesses met the criteria for held for sale beginning in the first quarter of fiscal 2020 and met the criteria for discontinued operation classification. As a result, the self-perform at-risk construction businesses are presented in the consolidated statements of operations as discontinued operations for all periods presented. Current and non-current assets and liabilities of these businesses are presented in the consolidated balance sheets as assets and liabilities held for sale. The Company reports its annual results of operations based on 52 or 53-week periods ending on the Friday nearest September 30. The Company reports its quarterly results of operations based on periods ending on the Friday nearest December 31, March 31, and June 30. For clarity of presentation, all periods are presented as if the periods ended on September 30, December 31, March 31, and June 30.
Free historical financial statements for Aecom. See how revenue, income, cash flow, and balance sheet financials have changed over 62 quarters since 2010. Compare with ACM stock chart to see long term trends.
Data imported from Aecom SEC filings. Check original filings before making any investment decision.