
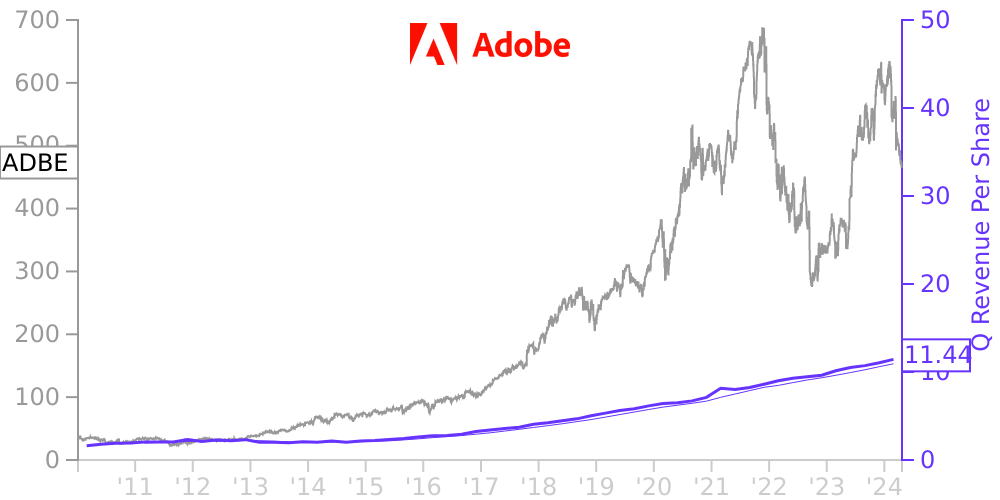
ADBE Stock Price Correlated With Adobe Financials
External Links ⌄
Income Statement
Cash Flow
Balance Sheet
ADBE Income Statement
Enable JavaScript and reload
Revenue, Net:
Cost of Goods & Services Sold:
Gross Profit:
Selling, General & Admin Expense:
Research & Development Expense:
Total Operating Expenses:
Operating Income:
Income Taxes:
Net Income:
ADBE Cash Flow
Enable JavaScript and reload
Operating Activities Net Income:
Depreciation, Depletion & Amortization:
Change in Accounts Receiveable:
Net Cash from Operations:
Repurchases/Buybacks Common Stock:
Issuance of Long-term Debt:
Cash Dividends Paid:
Net Cash from Financing Activities:
Property, Plant & Equipment Purchases:
Purchases of Businesses, Net of Cash:
Net Cash from Investing Activities:
Net Change in Cash & Equivalents:
ADBE Balance Sheet
Enable JavaScript and reload
Cash and Cash Equivalents:
Short-Term Investments:
Accounts Receivable, Net:
Inventories:
Total Current Assets:
Property, Plant & Equipment, Net:
Total Assets:
Accounts Payable:
Current Portion of Long-Term Debt:
Total Short-Term Liabilities:
Long Term Debt, Non-Current Portion:
Total Long-Term Liabilities:
Total Liabilities:
COMPANY PROFILE
We have prepared the accompanying unaudited Condensed Consolidated Financial Statements
pursuant to the rules and regulations of the Securities and Exchange Commission (the “SEC”).
Pursuant to these rules and regulations, we have condensed or omitted certain information and
footnote disclosures we normally include in our annual consolidated financial statements prepared
in accordance with accounting principles generally accepted in the United States of America
(“GAAP”). In management’s opinion, we have made all adjustments (consisting only of normal,
recurring adjustments, except as otherwise indicated) necessary to fairly present our financial
position, results of operations and cash flows. Our interim period operating results do not
necessarily indicate the results that may be expected for any other interim period or for the full
fiscal year. These financial statements and accompanying notes should be read in conjunction with
the consolidated financial statements and notes thereto in our Annual Report on Form 10-K for the
fiscal year ended November 27, 2009 on file with the SEC. The nine months ended September 3, 2010
financial results benefitted from an extra week in the first quarter of fiscal 2010 due to our
52/53 week financial calendar whereby fiscal 2010 is a 53-week year compared with fiscal 2009 which
was a 52-week year.
Free historical financial statements for Adobe Inc.. See how revenue, income, cash flow, and balance sheet financials have changed over 66 quarters since 2010. Compare with ADBE stock chart to see long term trends.
Data imported from Adobe Inc. SEC filings. Check original filings before making any investment decision.